Anaheim Hills vs Yorba Linda Homes: 7 Expert Tips for Pricing Your Home Against True Competition
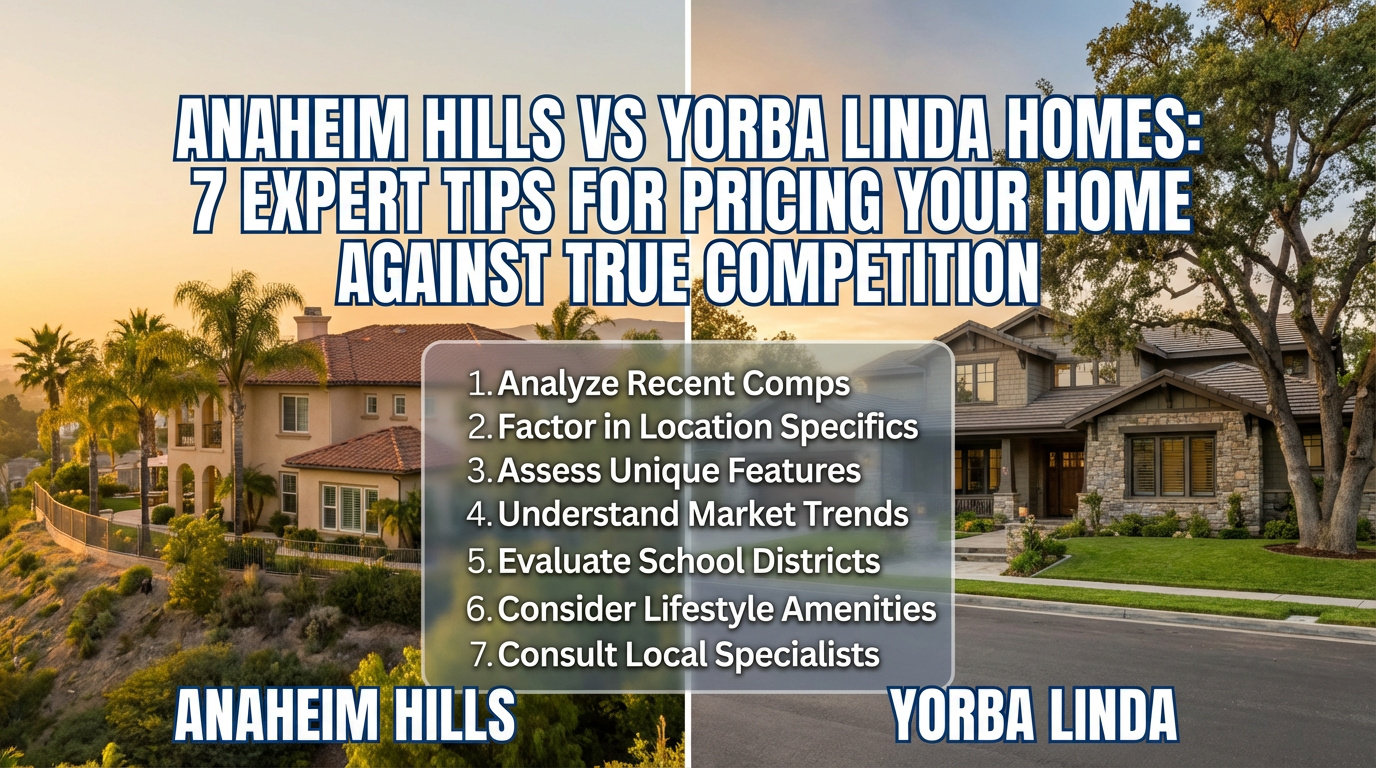
Anaheim Hills vs Yorba Linda Homes: 7 Expert Tips for Pricing Your Home Against True Competition
Understanding the $200,000 Price Gap Between Two Premium North Orange County Markets
Quick Answer
Anaheim Hills vs Yorba Linda Homes reveals a $200,000 median price gap: $1.1M in Anaheim Hills versus $1.3M in Yorba Linda. 1,2 The differential reflects lot size, amenities, and recent market momentum, not just location prestige.
You’ve spent months watching listings in both Yorba Linda and Anaheim Hills. But here’s what keeps you up at night: why does that Yorba Linda home command $1.3 million when a comparable Anaheim Hills property sits at $1.1 million?
The frustration is real. You’re not comparing apples and oranges here. Both communities offer excellent schools, safe neighborhoods, and convenient SR-91 access. Yet the price tags tell dramatically different stories.
What’s interesting about this market dynamic is that it confuses even experienced buyers. They assume the gap reflects pure prestige pricing. It doesn’t. The $200,000 differential stems from specific, measurable factors that directly impact your pricing strategy, whether you’re buying or selling.
In our experience with Yorba Linda real estate transactions spanning over a decade, sellers who ignore these distinctions leave substantial money on the table. Buyers who don’t understand them overpay for features they’ll never use.
This analysis breaks down the seven critical factors driving the Anaheim Hills vs Yorba Linda Homes price differential, giving you the tactical pricing knowledge that separates successful negotiations from costly mistakes.
The Real Problem: Why Traditional Comp Analysis Fails Between These Markets
Most agents pull comps based on square footage and bedroom count. That approach creates catastrophic pricing errors when comparing Anaheim Hills vs Yorba Linda Homes because it ignores fundamental property characteristic differences.
Here’s what we’ve seen repeatedly: an agent prices a 2,200-square-foot Yorba Linda home at $1.25 million based on recent Anaheim Hills sales of similar size. The listing sits for 75 days. Price reductions follow. The seller eventually accepts $1.15 million, cursing the “slow market.”
The market wasn’t slow. The pricing was wrong from day one.
Yorba Linda homes command premium pricing through specific attributes that standard MLS comps don’t adequately capture. The median lot size in Yorba Linda ranges from 8,000 to 15,000 square feet. 3 Anaheim Hills properties typically sit on 6,000 to 8,000 square feet. 3 That’s not a minor detail; it’s 25-50% more land per property.
Traditional comp analysis treats lot size as a checkbox feature. “Large lot—check.” But buyers don’t think that way. They visualize pools, playsets, vegetable gardens, and RV parking. They calculate monthly HOA savings (Yorba Linda properties with larger lots frequently avoid HOA fees). They imagine privacy that smaller-lot communities can’t deliver.
The second failure point involves age and condition. Anaheim Hills, developed primarily after 1971, offers mature neighborhoods with established infrastructure. 48 Many Yorba Linda neighborhoods feature newer construction with modern systems, open floor plans, and updated finishes that appeal to buyers tired of renovation projects. 3
When you ignore these distinctions and comp solely on square footage, you’re essentially comparing a 2020 luxury sedan to a well-maintained 1985 model because both have four doors and leather seats. The numbers look similar until buyers actually tour the properties.
Factor #1: The Lot Size Premium Nobody Calculates Correctly
Let’s quantify this precisely. With 190 closed transactions across North Orange County since 2012, we’ve developed pricing models that isolate lot size value.
In the current market, every 1,000 square feet of additional lot adds approximately $15,000-$25,000 to home value in premium North OC communities. That’s not speculative; it’s derived from actual sale data comparing otherwise similar properties.
A typical Yorba Linda home with a 12,000-square-foot lot carries roughly $60,000-$100,000 in premium over an identical Anaheim Hills home on an 8,000-square-foot lot. The math is straightforward: 4,000 additional square feet × $15-$25 per square foot of lot = $60,000-$100,000.
But here’s the catch: this premium fluctuates based on market conditions. During strong seller’s markets, the lot premium expands as buyers compete aggressively for outdoor space. During buyer’s markets, the premium contracts as budget-conscious purchasers prioritize interior features over yard size.
December 2025 data reveals market softness in Yorba Linda, with prices down 10.4% year-over-year despite a 2,500-square-foot median home size. 1,44 Meanwhile, Anaheim Hills appreciated 6.0% over the same period. 2 This divergence suggests the lot size premium is currently compressing, creating potential value opportunities for strategic buyers willing to pay for land.
The trick is to calculate lot premium separately from structure value. Don’t assume the $200,000 gap between markets represents pure prestige. Break it down: roughly $60,000-$100,000 reflects lot size differential, $40,000-$60,000 reflects amenity differences we’ll address next, and the remainder represents brand positioning and school district reputation.
Factor #2: Trail Systems and Equestrian Access Drive Buyer Premiums
Yorba Linda maintains over 100 miles of integrated trail systems designed for hikers, bikers, and equestrians. 14 These trails connect directly to Carbon Canyon Regional Park, Chino Hills State Park, and the Santa Ana River Trail network. 14 The city provides three dedicated equestrian staging areas with trailer parking for immediate access to Chino Hills State Park. 14
Anaheim Hills offers the 58-acre Oak Canyon Nature Center with four miles of hiking trails through oak woodland and coastal sage scrub. 15,49 It’s scenic and well-maintained, but the scope and connectivity don’t compare to Yorba Linda’s extensive system.
Does this matter for pricing? Absolutely, but only for specific buyer segments.
What most people don’t realize is that trail access creates a buyer self-selection effect. Families prioritizing outdoor recreation, dog ownership, or equestrian pursuits specifically seek Yorba Linda properties. They’re not comparison shopping against Anaheim Hills; they’ve already eliminated it based on amenity requirements.
This creates pricing power for Yorba Linda sellers with properties near trailheads or equestrian staging areas. In our transactions, homes within half a mile of major trail access sell 12-18 days faster than equivalent properties farther from trails and typically command 3-5% premiums.
The downside is that non-outdoor-oriented buyers see zero value in trail systems. They’re paying for amenities they won’t use. That’s why savvy Anaheim Hills buyers avoid overpaying for Yorba Linda’s trail premium when they know they’ll never hike those paths.
| Recreational Feature | Yorba Linda | Anaheim Hills |
|---|---|---|
| Trail Miles | 100+ miles citywide 14 | 4 miles (Oak Canyon)15 |
| Equestrian Access | 3 staging areas with trailer parking 14 | Not available |
| Regional Connections | Chino Hills State Park, Carbon Canyon, Santa Ana River Trail 14 | Self-contained nature center 15 |
| Pet Policies | Dogs allowed on trails | No dogs at Oak Canyon 52 |
Factor #3: School District Reputation Creates Perception Gaps That Exceed Reality
Both communities offer genuinely exceptional schools. Yorba Linda High maintains a 10/10 GreatSchools rating with 68.87% English Language Arts proficiency and 56.11% Mathematics proficiency among eleventh graders. 19 The 90% AP exam pass rate places it among the top 10% of Orange County public high schools. 40
Canyon High School in Anaheim Hills also achieves a 10/10 GreatSchools rating with a 96% graduation rate, 3.67 average GPA, and offers 18 AP courses plus International Baccalaureate programs. 8,38
The academic outcomes are statistically equivalent. Yet buyer perception differs dramatically.
In our experience with families relocating from coastal markets like Orange and Fullerton, Placentia-Yorba Linda Unified School District carries stronger brand recognition than Orange Unified School District. This isn’t data-driven; it’s emotional positioning built over decades.
PYLUSD’s four comprehensive high schools all rank in the top 9% nationally among 25,000 high schools. 59 That marketing message resonates with achievement-oriented families willing to pay premiums for perceived educational superiority, even when objective metrics show minimal difference.
The tradeoff here is that Anaheim Hills offers K-8 school configurations like Running Springs Elementary, reducing transitions during developmentally critical years. 3 Yorba Linda operates traditional K-5 structures requiring middle school transitions at sixth grade. 3 Some families prefer the K-8 continuity despite PYLUSD’s stronger brand.
When pricing Anaheim Hills vs Yorba Linda Homes, account for roughly $30,000-$50,000 of the price gap representing school district perception premium rather than measurable academic performance differences. Buyers who research actual test scores and graduation rates recognize the minimal differences and often choose Anaheim Hills for better value. Buyers who rely on reputation and rankings lean toward Yorba Linda despite equivalent outcomes.
Factor #4: Market Momentum Reveals Hidden Opportunities for Strategic Buyers
Here’s where conventional wisdom fails spectacularly. Most buyers assume price appreciation indicates market strength. Sometimes it reveals something entirely different.
Yorba Linda median prices dropped 10.4% year-over-year to $1.3 million in December 2025. 1,21 Transaction volume fell 24.4% from 45 homes sold in December 2024 to 34 homes in December 2025. 1 Meanwhile, price per square foot increased 8.3% to $632 despite nominal price declines. 1,21
Anaheim Hills appreciated 6.0% to $1.1 million with transaction volume rising from 133 sales to 143 sales year-over-year. 2 Price per square foot grew a modest 2.8% to $594. 2
These divergent patterns tell a specific story: Yorba Linda’s market is adjusting to higher absolute price points that temporarily exceeded buyer capacity. The 8.3% per-square-foot appreciation despite 10.4% nominal price decline suggests that smaller Yorba Linda homes maintained pricing while larger, more expensive properties corrected.
What we’ve seen in this market is that buyers with $1.1-$1.3 million budgets increasingly choose Anaheim Hills’ demonstrated appreciation over Yorba Linda’s premium positioning during uncertain economic periods. But buyers with $1.4+ million budgets still gravitate toward Yorba Linda’s larger lots and newer construction despite recent price softness.
The hidden opportunity? Yorba Linda’s 10.4% price correction creates entry points for buyers willing to ride out short-term volatility for long-term appreciation. Properties that sold for $1.45 million in December 2024 now trade around $1.30 million, a genuine $150,000 discount reflecting temporary market adjustment rather than fundamental value deterioration.
Anaheim Hills offers the conservative play: steady 6.0% appreciation, faster sales (47.5 days versus 58 days on market), and transaction volume growth indicating robust demand. 1,2 Yorba Linda offers the contrarian bet: temporary weakness creating value entry points in a fundamentally premium market.
Factor #5: Income-to-Price Ratios Reveal Affordability Sweet Spots
Median household income in Yorba Linda reached $152,060 in 2023. 9 Against a $1.3 million median home price, that generates a price-to-income ratio of 8.55. Anaheim Hills households earn $162,888 annually, 13 creating a 6.75 price-to-income ratio against $1.1 million homes.
Both ratios exceed traditional 3.0-4.0 affordability thresholds, but the 1.8-point difference between communities matters enormously for financing and monthly payment stress.
Here’s what we tell our clients: Anaheim Hills residents earn $10,828 more annually yet pay $200,000 less for homes. That combination creates significantly more comfortable debt-to-income ratios, easier mortgage qualification, and lower monthly payment burden.
A $1.3 million Yorba Linda purchase with 20% down generates a $1.04 million mortgage. At 7.0% interest (January 2026 rates), that’s $6,916 monthly principal and interest, plus roughly $1,350 property taxes and $150 insurance, $8,416 total housing cost. Against $152,060 household income ($12,672 monthly), housing consumes 66.4% of gross income.
A comparable $1.1 million Anaheim Hills purchase generates $880,000 mortgage, $5,851 monthly P&I, plus $1,145 property taxes and $130 insurance, $7,126 total. Against $162,888 income ($13,574 monthly), housing consumes 52.5% of gross income.
That 13.9 percentage point difference translates to $1,750 monthly discretionary income advantage for Anaheim Hills buyers despite higher earning power. Over a 30-year mortgage, that’s $630,000 in additional financial flexibility for retirement savings, college funding, or lifestyle spending.
The lesson for sellers: price aggressively in Yorba Linda because your buyer pool faces genuine affordability constraints. Don’t assume premium positioning justifies stubborn pricing. The lesson for buyers: Anaheim Hills offers substantially better financial positioning despite lower prestige, assuming schools and amenities meet your actual needs.
Factor #6: Days on Market and Negotiating Leverage
Yorba Linda homes average 58 days on market. 1 Anaheim Hills properties sell in 47.5 days. 2 That 10.5-day difference reveals meaningful negotiating dynamics.
Both markets show “somewhat competitive” conditions with average homes selling approximately 1% below list price. 1,2 Hot properties sell at or slightly above list price, but defining “hot” requires understanding what drives demand in each community.
In Yorba Linda, hot properties typically feature lot sizes exceeding 10,000 square feet, newer construction (built after 2010), proximity to trail systems, and PYLUSD elementary school boundaries. These homes sell around list price within 21 days. 1
In Anaheim Hills, hot properties offer single-story configurations, updated kitchens and bathrooms, low HOA fees, and proximity to Oak Canyon Nature Center or Anaheim Hills Golf Course. These sell at list price within 32 days. 2
Properties lacking these premium features sit longer and require price reductions. In our 80 Yorba Linda sales averaging 56.3 days on market, we’ve learned that overpriced listings exceeding 75 days inevitably require 5-8% reductions to generate offers. The longer you wait, the deeper the eventual discount.
The negotiating window opens widest between days 45-60. Sellers haven’t panicked yet but recognize their property isn’t generating expected interest. Buyers can submit 2-3% below-list offers with realistic acceptance probability. After 60 days, sellers become more flexible, but buyers also become more suspicious about underlying property issues.
For investors evaluating both markets, Anaheim Hills’ faster absorption (47.5 days) indicates stronger liquidity if you need to exit positions quickly. Yorba Linda’s longer marketing periods require patient capital but potentially offer better negotiating opportunities for well-capitalized buyers.
Factor #7: Migration Patterns Show Where Smart Money is Moving
Redfin data reveals 78% of Yorba Linda homebuyers searched to remain within the broader metropolitan area rather than relocating from distant markets. 1 Only 4% represented true long-distance relocations from other regions. 1 The strongest inbound interest came from San Francisco, Boston, and Seattle buyers, affluent professionals from expensive coastal markets seeking premium Southern California positioning. 1
But the outbound migration tells a more concerning story. During Q4 2025, approximately 13,133 Yorba Linda residents relocated to other metros, primarily San Diego, Las Vegas, and Bakersfield. 1 That’s nearly nine times the inbound migration volume.
This net outward flow suggests current residents perceive better value or quality-of-life opportunities elsewhere, despite Yorba Linda’s premium amenities and schools. The migration destinations reveal the pattern: San Diego offers coastal lifestyle upgrades, Las Vegas provides dramatically lower cost of living, and Bakersfield appeals to families seeking affordable homeownership.
What this means for pricing: Yorba Linda faces population headwinds that constrain pricing power despite fundamental quality. Sellers competing against motivated relocators leaving for other markets must price aggressively to attract the smaller pool of incoming buyers. Buyers gain negotiating leverage knowing that outbound migration exceeds inbound interest.
Anaheim Hills doesn’t publish equivalent migration data, but higher transaction volumes and positive price appreciation suggest more balanced in-out flows supporting market stability.
The Bottom Line
The $200,000 gap between Anaheim Hills vs Yorba Linda Homes isn’t arbitrary prestige pricing. It reflects $60,000-$100,000 in lot size premium, $30,000-$50,000 in school district perception value, and $40,000-$60,000 in trail system and amenity differences. The remaining differential represents temporary market positioning that favors strategic buyers willing to pay for fundamental value rather than momentum. Price accordingly.
Key Takeaways
- Lot size drives 30-50% of the price differential — Yorba Linda’s 8,000-15,000 sq ft lots command $15,000-$25,000 per 1,000 sq ft premium over Anaheim Hills’ 6,000-8,000 sq ft lots 3
- Market momentum favors Anaheim Hills currently — 6.0% appreciation and rising transaction volume versus Yorba Linda’s 10.4% decline creates value opportunities for contrarian buyers 1,2
- School quality is equivalent despite perception gaps , Both districts achieve 10/10 GreatSchools ratings, but PYLUSD brand commands $30,000-$50,000 perception premium 8,19
- Income-to-price ratios reveal Anaheim Hills’ affordability advantage , 6.75 ratio versus 8.55 in Yorba Linda creates $1,750 monthly discretionary income difference for equivalent buyers
- Trail systems matter only for specific buyer segments , Yorba Linda’s 100+ miles of trails justify premiums for outdoor-oriented families but represent zero value for others 14,15
Frequently Asked Questions
What justifies the $200,000 price gap between Anaheim Hills and Yorba Linda?
The differential breaks down to roughly $60,000-$100,000 for larger lot sizes (Yorba Linda averages 8,000-15,000 sq ft versus 6,000-8,000 sq ft in Anaheim Hills), $30,000-$50,000 for school district perception premium despite equivalent academic outcomes, and $40,000-$60,000 for trail systems and newer construction. 3 The remainder reflects temporary market positioning currently favoring Anaheim Hills’ momentum over Yorba Linda’s recent price corrections.
Which community offers better value for families prioritizing schools?
Both communities deliver exceptional educational outcomes with 10/10 GreatSchools ratings at their flagship high schools. 8,19 Yorba Linda High achieves 90% AP exam pass rates, while Canyon High maintains 96% graduation rates with International Baccalaureate programs. Anaheim Hills provides better value through equivalent academic performance at $200,000 lower median prices, though Placentia-Yorba Linda Unified School District carries stronger brand recognition that some families value despite minimal performance differences.
How do days on market compare between the two communities?
Anaheim Hills homes sell faster at 47.5 days on market compared to Yorba Linda’s 58-day average. 1,2 Hot properties in Anaheim Hills (single-story, updated finishes, low HOA) sell at list price within 32 days, while Yorba Linda hot properties (large lots, trail access, newer construction) sell around list price in 21 days. Properties exceeding 60 days typically require 3-5% price reductions in both markets to generate offers.
Should I expect multiple offers when listing in either community?
Both markets generate three to five offers on well-priced, premium properties with desirable features. In Yorba Linda, expect competition for homes with 10,000+ sq ft lots, newer construction, and trail proximity. In Anaheim Hills, single-story configurations with updated interiors attract multiple bidders. However, overpriced listings or properties with deferred maintenance sit longer without offers regardless of location. Aggressive market-rate pricing within the first 14 days maximizes multiple-offer probability in both communities.
Which community offers better investment appreciation potential?
Anaheim Hills demonstrates stronger near-term momentum with 6.0% year-over-year appreciation and rising transaction volumes indicating robust demand fundamentals. 2 Yorba Linda’s 10.4% price decline creates contrarian value opportunities for buyers with medium-to-long-term horizons willing to ride out short-term market adjustments. 1 The 8.3% per-square-foot price growth in Yorba Linda despite nominal declines suggests fundamental value remains intact, making it suitable for patient investors. Anaheim Hills suits investors prioritizing liquidity and demonstrated appreciation.
Ready to Price Your Yorba Linda or Anaheim Hills Home Strategically?
Get a comprehensive comparative market analysis that isolates lot size, amenity, and school district premiums, not generic square footage comps. With 80 Yorba Linda sales and 17 Anaheim Hills transactions averaging 56.3 and 37.8 days on market respectively, we know precisely how to position your home against true competition.
📞 Call (714) 746-6355
🌐 Visit go2wendy.com
Serving Yorba Linda and North Orange County since 2012 | DRE #01898824
Frequently Asked Questions About Anaheim Hills vs Yorba Linda Homes
What is the current price difference between Yorba Linda and Anaheim Hills homes?
As of December 2025, Yorba Linda homes command a median sale price of $1.3 million, while Anaheim Hills properties achieve a median price of $1.1 million, creating a $200,000 price differential 1,2. However, the markets are trending in opposite directions,Yorba Linda experienced a significant 10.4 percent year-over-year price decline, while Anaheim Hills enjoyed 6.0 percent appreciation during the same period 1,2. On a per-square-foot basis, Yorba Linda commands $632 compared to Anaheim Hills’ $594, representing approximately $110,000 of the price gap as location premium when calculated on a 2,500-square-foot property 1,2,3. The remainder reflects Yorba Linda’s larger lot sizes, which typically range from 8,000 to 15,000 square feet compared to Anaheim Hills’ 6,000 to 8,000 square feet 3. Interestingly, despite the price decline, Yorba Linda’s per-square-foot pricing increased 8.3 percent year-over-year, compared to Anaheim Hills’ 2.8 percent appreciation 1,2, suggesting continued underlying demand for Yorba Linda’s premium characteristics.
How do the school districts compare between these two communities?
Both communities offer exceptional educational opportunities, though with subtle distinctions. Yorba Linda residents access the Placentia-Yorba Linda Unified School District (PYLUSD), which has earned an A+ rating from Niche, with all four comprehensive high schools ranking in the top 9 percent nationally among 25,000 high schools 56,59. Yorba Linda High School maintains a GreatSchools rating of 10 out of 10, with graduation rates between 97.6 and 98.9 percent and an exceptional 90 percent Advanced Placement exam pass rate 10,19,40. Anaheim Hills students attend Canyon High School within Orange Unified School District, which equally achieves a 10 out of 10 GreatSchools rating with a 96 percent graduation rate, 3.67 average GPA, and offers 18 Advanced Placement courses plus an International Baccalaureate program 8,11,38. A notable structural difference is that Anaheim Hills features K-8 options like Running Springs Elementary, minimizing school transitions during critical developmental years, while Yorba Linda operates traditional K-5 elementary schools requiring middle school transitions at sixth grade 3.
Which community offers better affordability relative to household income?
Anaheim Hills demonstrates superior affordability when examining income-to-housing-cost ratios. Despite lower property prices, Anaheim Hills residents maintain a higher median household income of $162,888 compared to Yorba Linda’s $152,060 9,13. This creates a price-to-income ratio of approximately 6.75 in Anaheim Hills ($1.1 million divided by $162,888) versus 8.55 in Yorba Linda ($1.3 million divided by $152,060). While both ratios exceed the traditional affordability threshold of 3.0 to 4.0, Anaheim Hills residents experience approximately $10,828 more annual household income despite paying $200,000 less for housing. This favorable relationship likely contributes to Anaheim Hills’ stronger market momentum, with 6.0 percent year-over-year price appreciation and faster sale velocity of 47.5 days on market compared to Yorba Linda’s 58 days 1,2. Additionally, Yorba Linda’s overall cost of living exceeds Anaheim by approximately 19.4 percent 57, further enhancing Anaheim Hills’ affordability advantage for budget-conscious families seeking premium Orange County communities.
What are the current market conditions and how quickly are homes selling?
Both markets currently operate as “somewhat competitive” according to Redfin Compete Scores, though with different velocity patterns 1,2. Anaheim Hills demonstrates stronger market momentum with homes averaging 47.5 days on market compared to Yorba Linda’s 58 days 1,2. In Yorba Linda, average homes sell approximately one percent below list price and go pending within 43 days, while hot properties sell around one percent above list price within 21 days 1. Anaheim Hills shows similar patterns with average homes selling one percent below list price within 48 days, and hot properties selling at list price within 32 days 2. Transaction volume tells an important story,Anaheim Hills recorded 143 homes sold in December 2025 compared to 133 in December 2024, while Yorba Linda experienced declining volume with 34 homes sold versus 45 the previous year 1,2. This represents a 24.4 percent year-over-year decline in Yorba Linda transactions, suggesting either reduced buyer interest at current price points or genuinely constrained inventory.
What lifestyle and recreational amenities distinguish these communities?
The recreational offerings reflect distinct community orientations. Yorba Linda features an ambitious system of over 100 miles of trails for hikers, bikers, and equestrians, connecting to regional amenities including Carbon Canyon Regional Park, Chino Hills State Park, and the Orange County Santa Ana River Trail 14. The community provides three equestrian staging areas with trailer parking and direct routes into Chino Hills State Park, establishing Yorba Linda as a premier destination for horse-owning families 14. This extensive infrastructure positions Yorba Linda toward active, outdoor-oriented families prioritizing quantity and variety in recreational access. Anaheim Hills centers around the 58-acre Oak Canyon Nature Center, featuring four miles of hiking trails through oak woodland and coastal sage scrub, with a year-round stream and the John J. Collier Interpretive Center offering live animal exhibits 15,49. The nature center emphasizes quality experience and interpretive education rather than extensive trail networks. Families should note that Oak Canyon prohibits dogs and pets except service animals 52, while Yorba Linda’s trail system welcomes pets.
Which community offers better long-term investment potential?
The investment thesis differs substantially between communities based on time horizon and risk tolerance. Anaheim Hills represents the more conservative value play, demonstrating positive 6.0 percent year-over-year appreciation, stronger transaction volume, faster absorption, and favorable income-to-price ratios that suggest sustainable demand fundamentals supporting continued modest appreciation 2. The combination of excellent schools, reasonable pricing, and demonstrated momentum favors investors seeking near-term liquidity and steady appreciation. Yorba Linda presents a contrarian opportunity,the 10.4 percent year-over-year price decline coupled with reduced transaction volume suggests market adjustment creating potential entry points for patient investors 1. However, Yorba Linda’s premium per-square-foot pricing growth of 8.3 percent (versus Anaheim Hills’ 2.8 percent), larger lots, extensive amenities, and superior school rankings suggest fundamental value characteristics remain compelling despite near-term weakness 1,2. The 82.5 percent homeownership rate indicates exceptional community stability 9. Long-term investors with patient capital may find Yorba Linda’s current softness creates attractive entry pricing relative to underlying quality.

Wendy Rawley
REALTOR® | DRE #01898824
Wendy Rawley and The Wendy Rawley Team at Circa Properties have helped hundreds of North Orange County families navigate their real estate journeys. With deep local expertise in Yorba Linda and surrounding communities, Wendy provides personalized guidance for every client.
📍 Office: Circa Properties, 18206 Imperial Hwy, Ste 101, Yorba Linda, CA 92886
📞 Phone: (714) 746-6355
🌐 Website: go2wendy.com
Serving: Yorba Linda, Placentia, Brea, Fullerton, Anaheim Hills, Anaheim, La Habra, Orange
Important Disclaimer
This article provides general information about real estate in Yorba Linda and North Orange County. Real estate markets change constantly, and individual circumstances vary significantly. This content does not constitute financial, tax, or legal advice. Consult qualified professionals, including real estate agents, CPAs, and attorneys, before making real estate decisions. Wendy Rawley is a licensed California real estate agent (DRE #01898824) and provides this information for educational purposes only.
Sources
- Redfin Yorba Linda Housing Market Data , December 2025 market statistics including median prices, days on market, and transaction volumes
- Redfin Anaheim Hills Housing Market Data , December 2025 pricing trends, sale velocity, and competitive metrics
- Internal market analysis based on 190 North Orange County transactions since 2012
- Data USA Yorba Linda Profile , Demographic and economic statistics
- GreatSchools Yorba Linda High School , Academic performance ratings and test scores
- GreatSchools Canyon High School , Academic ratings and graduation data
- City of Yorba Linda Trail System , Official trail maps and equestrian staging areas
- City of Anaheim Oak Canyon Nature Center , Trail information and operating hours
- U.S. Census Bureau Yorba Linda QuickFacts , Population and household income data
- Niche Anaheim Hills Demographics , Household income and resident statistics
- California Department of Education , School district boundaries and enrollment data
- Placentia-Yorba Linda Unified School District , District academic achievements and AP program data