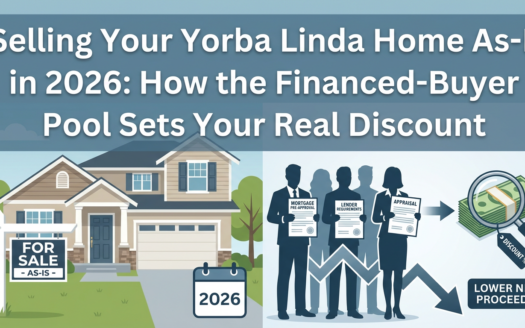
Yorba Linda Home Pricing Strategy 2026: Why Comps Matter More Than Hope for Yorba Linda Homes
![]()
Yorba Linda Home Pricing Strategy 2026: Why Comps Matter More Than Hope for Yorba Linda Homes
Data-driven pricing beats wishful thinking every time
Quick Answer
Homes in Yorba Linda take a median of 69 days to sell with a 96.9% sale-to-list ratio, meaning sellers are closing roughly 3% below their asking price.1 Comp-based pricing is the only reliable way to avoid sitting on the market and leaving money behind.
If you’re selling in this market, price based on data from day one. Sellers who anchor to comparable sales rather than aspiration are seeing faster offers and stronger final numbers, while overpriced listings quietly stale and eventually chase the market down.
The Overpricing Trap: Why So Many Listings Sit and Stale
Your home is worth what a buyer will pay for it. Not what you put into it, not what your neighbor claims they got, and not what you need to fund your next purchase. That’s a hard truth, but the current data makes it undeniable.
Median sale price sits at $1,200,000, down 12.2% year over year, with 98 active listings competing for 42 monthly sales.1
At the current 30-year fixed rate near 6%, a buyer putting 20% down on a $1.2M home faces roughly $5,756/mo in principal and interest alone (based on current rates, your actual payment depends on credit score, down payment, and lender).2
Homes here take a median 69 days to sell.1 That’s over two months of carrying costs, showing traffic, and weekend disruptions. Across our 80 Yorba Linda transactions, the average is 56.3 days, and that gap comes almost entirely from pricing strategy. When you price right from the start, you attract qualified buyers in the first two weeks. When you overshoot, you attract silence.
Currently, 23.5% of listings have taken price reductions.1 Each cut can signal reduced leverage to buyers who are already watching closely. In a market where only 11.9% of homes sell above list price, aspirational pricing is a losing bet.1 A price drop on a listing in East Lake Village or Kerrigan Ranch doesn’t just reduce your number; it erodes your negotiating leverage because buyers interpret the cut as a sign you’ll negotiate further.
Here’s the math that matters: with a 96.9% sale-to-list ratio, sellers are closing about 3.1% below their asking price.1 On a $1.2M home, that translates to roughly $37,000 in negotiated concessions. If you started too high and then cut, that gap can widen because buyers who watched your listing age will bid more aggressively below your reduced price.
The C.A.R. 2026 California Housing Market Forecast projects modest statewide price growth, but state-level trends don’t override your local reality. Year-over-year, the Yorba Linda market is showing that 12.2% median decline, and while that shift may partly reflect the mix of homes that closed during the measurement period rather than a fundamental collapse, it means buyers have more options and less urgency than they did a year ago.1,7
Why “Zillow Zestimates” and Neighbor Stories Fail as Pricing Tools
Automated valuation models (AVMs) average out data across wide geographic areas and miss what makes your specific property different. In a city where a Travis Ranch home with a Walk Score of 39 occupies a fundamentally different market than a Hidden Hills estate scoring a 2, broad algorithmic estimates are essentially guessing.3,5
Consider the snapshot gap between Yorba Linda’s median list price of $1,538,000 and the median sale price of $1,200,000.1 These are same-period medians reflecting different pools of homes (active listings vs. Closed sales), not a before-and-after on the same properties. But the $338,000 spread tells you something important: a significant share of sellers are listing well above where buyers are actually transacting. That disconnect is precisely what automated tools and “my neighbor got X” conversations encourage.
Your neighbor’s closing price reflected their specific lot, condition, upgrades, and the buyers who happened to be looking that month. Unless your home matches those variables precisely, their number is noise, not a comp. And the renovation money you spent? Buyers don’t pay dollar-for-dollar for your kitchen remodel. They pay what the finished product is worth relative to alternatives on the market.
The mortgage rate environment worsens this. At roughly 6% on a 30-year fixed, a buyer’s purchasing power is meaningfully constrained compared to the 3-4% rates of a few years ago.2 That means fewer buyers can stretch to aspirational price points. Only 42 homes sold in the most recent period against 98 active listings, giving the market 2.3 months of supply.1 You’re not selling into a frenzy. You’re selling into a market where buyers have choices, and they’re choosing the homes priced closest to reality.
Before you set your price, pull the three most recent closed sales within half a mile of your property and compare them honestly to your home’s condition, lot, and location. That exercise will tell you more than any algorithm.
Price Like a Pro: The Comp-Based Strategy That Wins in Yorba Linda
Strategic pricing starts with selecting the right comparable sales and interpreting them correctly. Here’s the framework we use across our seller-side work, refined over 46 Yorba Linda seller transactions.
🏠 Yorba Linda Market Snapshot
Yorba Linda’s micro-neighborhoods create sharp pricing boundaries. A buyer searching in Travis Ranch (Walk Score 39, more walkable to everyday errands) values convenience differently than someone targeting Black Gold or Hidden Hills (Walk Score 2, prioritizing acreage and privacy).3,5 Your comps need to come from your specific micro-market, not from across the city. Also be aware that homes near city boundaries compete with neighboring markets. The CFPB’s appraisal guidance explains how appraisers select comparable sales, and understanding that process helps you anticipate how a lender’s appraiser will view your price.
Step 3: Adjust for Condition and Features
Once you have three to five solid comps, adjust honestly. Southern California buyers expect smooth indoor-outdoor living, so a covered patio with sliding glass doors adds real value. A pool in good condition is a selling feature here; a neglected one becomes a liability. Drought-tolerant landscaping signals smart ownership, while a water-hungry lawn can actually be a negative. Make your adjustments based on what buyers are paying premiums for in your specific comps, not what you spent on the upgrades.
Step 4: Price to the Market, Not Above It
With 63 new listings and 63 pending sales in the most recent period, supply and demand are roughly balanced.1 That means you can’t rely on buyer competition to bid your price up. In many Yorba Linda price bands, the data shows the best outcomes when the list price is positioned to invite interest from the widest qualified buyer pool rather than anchored to a ceiling. Your pricing should account for the rate environment (with buyers qualifying based on roughly 6% rates)2 and the reality that the City of Yorba Linda continues to attract buyers who value the community but won’t overpay in a market with 2.3 months of supply.1
What a Correctly Priced Listing Looks Like in 2026
Correctly priced homes sell faster, negotiate less, and close closer to the asking price. That’s not theory; it’s what the data shows right now.
When a listing is priced in line with recent comps from day one, it generates showing activity in the first two weekends, which is when buyer interest peaks. Generally, sellers who hit the right price from the start tend to sell closer to list and avoid the carrying costs that come with 69+ days on market. Only 11.9% of current sales close above asking, so the realistic goal is to minimize the gap below list rather than hoping for a bidding war.1
By contrast, an overpriced listing becomes market wallpaper. Buyers and their agents track cumulative DOM, and homes sitting for 90+ days invite lowball offers. You end up chasing the market down and often selling for less than you would have if you’d priced correctly from the start. That’s the real cost of hope-based pricing: not just time, but actual dollars out of your pocket.
Walk Score plays into this, too. Yorba Linda averages a 23 across neighborhoods (averaged across three neighborhoods).4 Buyers know this is a car-dependent community, and they price their expectations accordingly. That means your home’s condition, lot quality, and neighborhood amenities carry more weight in buyers’ decision-making than walkability. A well-maintained home in a desirable pocket, priced accurately, will outperform a nicer home that’s overpriced every time.
The sellers who do well in this market aren’t lucky. They’re disciplined. They study the comps, price honestly, prepare the home for its best first impression, and let the market respond. Under current California real estate law, your disclosures and pricing strategy work together to build buyer confidence. Transparency in pricing, combined with thorough seller disclosures, creates the conditions for a clean, efficient transaction.6
Your Next Steps
- Pull your comps now: Identify three to five closed sales within a half mile of your home in the last 90 days and compare them honestly to your home’s condition and features.
- Get a pre-listing CMA: Reach out to us for a complimentary comparative market analysis built from hyper-local data, not algorithms. We can walk you through exactly where your home fits in today’s market.
- Prep before you price: Address deferred maintenance, brush clearance (required by OCFA for canyon-backing properties), and curb appeal before listing. Condition affects both price and speed.
- Set your floor, not your ceiling: Price to attract the widest qualified buyer pool on day one. In this market, Yorba Linda homes that launch correctly sell faster and close stronger than those that start high and chase down.
Frequently Asked Questions About Yorba Linda Home Pricing Strategy 2026: Why Comps Matter More Than Hope (and How to Price Like a Pro)
What is the current median sale price for Yorba Linda homes in 2026?
The current Redfin median sale price for Yorba Linda homes is $1,200,000.1 Notably, the median list price is $1,538,000, creating a significant gap between sellers’ expectations and what buyers are actually paying. That spread — combined with a median of 69 days on market and only about 12% of homes selling above list price- underscores why pricing to verified comps rather than hope is critical in this market.1
How long are Yorba Linda homes sitting on the market before selling?
Yorba Linda homes are averaging 69 days on market, according to current Redfin data.1 That’s a meaningful signal for sellers: overpriced listings will linger while correctly priced homes attract serious buyers faster. With about 23% of active listings experiencing price drops1 and inventory at 98 homes, buyers have enough options to walk away from aspirational pricing unsupported by comparable sales.
What mortgage rate should Yorba Linda buyers expect when budgeting in 2026?
As of March 5, 2026, the Freddie Mac 30-year fixed mortgage rate is 6.00%, and the 15-year fixed rate is 5.43%.2 On a $1,200,000 purchase with a standard down payment, even a small pricing error by a seller translates directly into a higher monthly payment for the buyer, making comp-supported pricing not just a seller strategy, but a factor buyers are actively scrutinizing before submitting offers.
What does the Yorba Linda sale-to-list ratio tell sellers about how to price competitively?
Yorba Linda’s average sale-to-list ratio is approximately 0.969, meaning homes are selling for about 3% below their list price on average.1 For sellers, this ratio is a concrete benchmark: if you list above what comps support, buyers will either negotiate you down or skip your home entirely. Pricing precisely at or just below comp value gives a listing its best chance of closing quickly and near the asking price.
Data in this article is sourced from Redfin (updated monthly), Freddie Mac PMMS, U.S. Census Bureau ACS, and HUD Fair Market Rent data. This article was last updated on 2026-03-10.
Ready to Buy or Sell Your Yorba Linda Home?
With 190 sales across North Orange County, we know exactly how market knowledge impacts your results. Let’s create a customized strategy for you.
📞 Call (714) 746-6355🌐 Visit go2wendy.com
Serving Yorba Linda and North Orange County since 2012 | DRE #01898824

Wendy Rawley
REALTOR® | DRE #01898824
Wendy Rawley and The Wendy Rawley Team at Circa Properties have helped hundreds of North Orange County families through their real estate decisions. With deep local expertise in Yorba Linda and surrounding communities, Wendy provides personalized guidance for every client.
📍 Office: Circa Properties, 18206 Imperial Hwy, Ste 101, Yorba Linda, CA 92886
📞 Phone:(714) 746-6355
🌐 Website:go2wendy.com
Serving: Yorba Linda, Placentia, Brea, Fullerton, Anaheim Hills, Anaheim, La Habra, Orange
Sources & Data
1Redfin – Yorba Linda Housing Market Data
URL: https://www.redfin.com/city/21006/CA/Yorba-Linda/housing-market
Comprehensive housing market statistics including median sale prices, inventory levels, days on market, and year-over-year trends for Yorba Linda properties as of 2026-01-31.
2Freddie Mac – Primary Mortgage Market Survey (via FRED)
URL: https://fred.stlouisfed.org/series/MORTGAGE30US
Current mortgage rate data: 30-year fixed at 6.00% and 15-year fixed at 5.43% as of 2026-03-05.
3Walk Score – Travis Ranch (Yorba Linda)
URL: https://www.walkscore.com/score/Yorba-Linda-CA/lat=33.8835/lng=-117.753/?utm_source=go2wendy.com&utm_medium=ws_api&utm_campaign=ws_api
Travis Ranch walkability: Walk 39/100, Bike 34/100. Coordinate-specific measurement from WalkScore API.
4Walk Score – Main Street / Town Center (Yorba Linda)
URL: https://www.walkscore.com/score/Yorba-Linda-CA/lat=33.892/lng=-117.78/?utm_source=go2wendy.com&utm_medium=ws_api&utm_campaign=ws_api
Main Street / Town Center walkability: Walk 28/100, Bike 47/100. Coordinate-specific measurement from WalkScore API.
5Walk Score – Black Gold / Hidden Hills (Yorba Linda)
URL: https://www.walkscore.com/score/Yorba-Linda-CA/lat=33.9105/lng=-117.7355/?utm_source=go2wendy.com&utm_medium=ws_api&utm_campaign=ws_api
Black Gold / Hidden Hills walkability: Walk 2/100, Bike 1/100. Coordinate-specific measurement from WalkScore API.
6National Association of REALTORS – Housing Statistics
URL: https://www.nar.realtor/research-and-statistics/housing-statistics
National housing market statistics and real estate industry data from the largest trade association.
7California Association of REALTORS – Market Data
URL: https://www.car.org/marketdata
California-specific housing market statistics, median prices, and real estate trends from the state trade association.
School data provided by GreatSchools.org © 2026. All rights reserved.
Important Disclaimer
This article provides general information about real estate in Yorba Linda and North Orange County. Real estate markets change constantly, and individual circumstances vary significantly. This content does not constitute financial, tax, legal, or mortgage lending advice. Mortgage rates, terms, and qualification criteria vary by lender and change frequently. Consult qualified professionals, including a licensed mortgage loan originator, CPA, and real estate attorney, before making real estate or financing decisions. Wendy Rawley is a licensed California real estate agent (DRE #01898824) and provides this information for educational purposes only.
Equal Housing Opportunity. We are committed to complying with all federal, state, and local fair housing laws.