Best Yorba Linda Neighborhoods for Families 2025 Compared
![]()
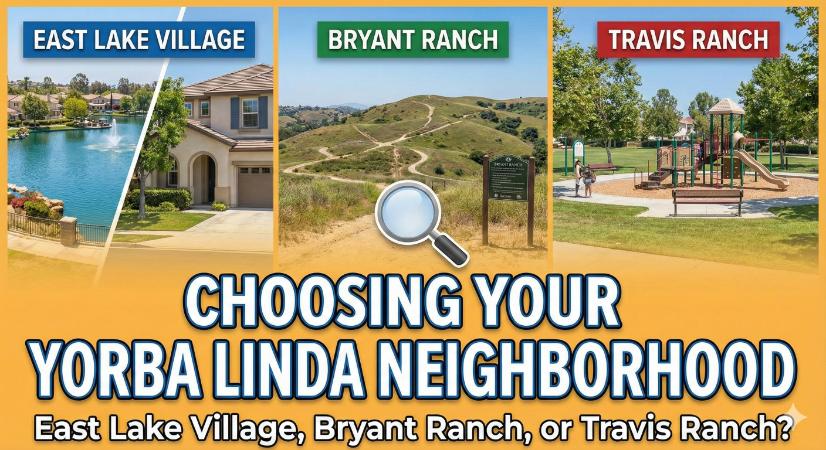
East Lake Village Bryant Ranch or Travis Ranch? Choosing Your Yorba Linda Neighborhood
By Wendy Rawley REALTOR® | DRE #01898824 | December 2025
We’ve been getting a lot of calls this fall from families relocating to Orange County who’ve narrowed their search to Yorba Linda but can’t determine which neighborhood best fits their situation. East Lake Village sounds appealing until they see the HOA fees. Bryant Ranch checks every box until they realize that school boundaries place them in a different elementary school than they expected. Travis Ranch seems perfect, but they discover that half the listings are actually in a different section with a completely different vibe. These three neighborhoods share a zip code and a reputation for quality, but they’re not interchangeable – and the differences matter more than most buyers realize until they’re already in escrow.
Right now, Yorba Linda’s overall median sits at $1.4 million according to Redfin1 – up 7.7 percent from last year. But that citywide number doesn’t tell you much when East Lake Village listings start around $1.6 million2 while Travis Ranch has homes ranging from $515,000 to $3.5 million3. The spread within each neighborhood is almost as dramatic as the spread between them. Here’s what you actually need to know before touring any of these communities.
The real price differences – and what they actually buy you
East Lake Village commands the highest entry point among these three neighborhoods, with median listing prices reaching $1.8 million as of September 2025 (Redfin September 2025), a 7.3 percent year-over-year increase. That premium buys you something specific: lakefront living with resort-style amenities that you won’t find elsewhere in Yorba Linda. The neighborhood was built around a series of man-made lakes, and homes backing to water consistently trade at the top of the price range. We’re talking listings that reach $2.8 million for the prime waterfront positions. But here’s what catches buyers off guard: the HOA fees reflect the amenity package. You’re paying for lake maintenance, clubhouse access, and community pools in addition to standard association costs.
Bryant Ranch has seen the most dramatic year-over-year appreciation of the three neighborhoods, with median listing prices jumping 45.8 percent to $1.7 million by September 2025 (Realtor.com, September 2025)4. That appreciation rate suggests a limited inventory of premium properties meeting strong buyer demand – families are competing hard for the best homes here. The neighborhood doesn’t have lakes or waterfront views, but it offers something increasingly rare: larger lots in the 7,000- to 9,000-square-foot range with mature landscaping and an established community character. October 2025 data show median sale prices settling around $1.6 million (Redfin October 2025), suggesting some normalization after the dramatic run-up.
Travis Ranch offers the widest price range of the three, with current listings ranging from $515,000 to $3.5 million. That’s not a typo – the neighborhood includes everything from attached townhome-style properties to sprawling custom estates. The median listing sits around $1.7 million as of September 2025, but median sold prices come in closer to $1.5 million (Redfin October 2025)6. Market pace here has actually improved with homes moving in 43 days versus 51 days the previous year6. That acceleration tells you buyers are finding what they want at prices they can justify.
School boundaries that actually affect your daily life
All three neighborhoods fall within the Placentia-Yorba Linda Unified School District, which carries an A+ overall rating from Niche and serves 23,138 students across 33 schools (Niche, 2024)7. The district averages a 94 percent graduation rate with mean SAT scores of 1,3007 – numbers that consistently place PYLUSD among the top performers in Orange County. But district-level stats mask essential differences at the elementary level, where your specific street address determines which campus your kids attend.
Bryant Ranch Elementary holds a 9/10 GreatSchools rating with an A grade from Niche (GreatSchools, 2024)8, and it primarily serves the Bryant Ranch neighborhood – the school and community share more than just a name. Parents here benefit from walkability that’s increasingly rare in suburban Orange County. The campus sits within the neighborhood boundaries, so you’ll see kids walking and biking to school rather than sitting in the drop-off line on Imperial Highway.
East Lake Village families typically feed into Fairmont Elementary, which also carries a 9/10 GreatSchools rating and A Niche grade9. The school has developed a reputation for strong parent involvement – the PTA runs robust enrichment programs that supplement district curriculum. But here’s the catch: not every East Lake address falls within Fairmont boundaries. Some sections of the neighborhood are zoned for Lakeview Elementary (8/10 GreatSchools)10 or other nearby campuses. Before making an offer on any East Lake property, verify the exact school assignment through the district – boundary maps don’t always align with neighborhood marketing materials.
Travis Ranch has its own unique situation. Travis Ranch School operates as a K-8 campus, meaning students can stay at the same school from kindergarten through eighth grade (GreatSchools, 2024)11. The school holds a 7/10 GreatSchools rating – solid but slightly below Bryant Ranch and Fairmont. However, many Travis Ranch families value the continuity of keeping kids in one place for nine years over chasing marginally higher test scores. The K-8 model also eliminates the middle school transition that can be socially challenging for some students.
All three neighborhoods converge at Yorba Linda High School for students in grades 9-12, where the differences disappear. YLHS has a perfect 10/10 GreatSchools rating and an A+ Niche grade, with a 99 percent graduation rate (GreatSchools, 2024)12. Average GPA is 3.68 with SAT scores averaging 1,32012. The school serves 1,584 students and offers strong athletics (A- rating) and robust college-prep programming. Wherever you buy, your high schooler ends up at the same excellent campus.
What your weekends actually look like in each neighborhood
Yorba Linda’s recreational infrastructure sets it apart from most Orange County suburbs. The city has invested in over 100 miles of trails coordinated for hikers, bikers, and equestrians13 – these aren’t isolated paths but a connected system linking to Carbon Canyon Regional Park, Chino Hills State Park, the Orange County Santa Ana River Trail, and Yorba Regional Park13. How you access this network differs significantly by neighborhood.
East Lake Village offers something the other two neighborhoods can’t match: water-based recreation. The community’s lakes support fishing, paddleboarding, and kayaking within the neighborhood boundaries. The HOA maintains private beach areas and a community pool complex that feels more like a resort than a typical subdivision amenity. If your family prefers water activities to hiking, East Lake delivers. The trade-off is distance to trailheads – you’re driving to Chino Hills State Park rather than walking there.
Bryant Ranch sits closer to the equestrian character that defines much of Yorba Linda’s identity. The neighborhood backs up to trail access points that connect to the broader citywide system. Weekend mornings here, you’ll see horses on the trails as often as joggers. The community has maintained wider streets and design standards that accommodate horse trailers – even if you’re not an equestrian yourself, this shapes the neighborhood’s low-density, semi-rural feel despite being solidly suburban.
Travis Ranch offers perhaps the most convenient trail access of the three, with multiple connection points to the regional system. The Weir Canyon Wilderness Park trailhead is within easy reach, providing access to Chino Hills State Park without navigating crowded parking areas. Families here tend toward hiking and mountain biking over water activities. The Parks and Recreation Department programs serve all three neighborhoods equally, offering youth sports, aquatics, facility rentals, preschool programs, and senior services14.
The commute reality from each neighborhood
Yorba Linda sits in North Orange County with access to the 91, 57, and 241 toll roads – but your specific neighborhood determines which routes make sense and how long you’ll actually spend in the car. East Lake Village positions you closest to the 241, which provides the fastest (though toll-heavy) route to Irvine, Costa Mesa, and South County employment centers. Morning traffic on Imperial Highway heading toward the 91 can add 15-20 minutes during peak school drop-off hours, roughly 7:45 to 8:30 AM.
Bryant Ranch is centrally located, with reasonable access to multiple freeways without being immediately adjacent to any. You’re looking at surface-street travel before reaching the 91 or 57, but the neighborhood’s location lets you choose your route based on real-time traffic rather than being locked into a single freeway access point. Families with one spouse commuting to LA and another heading to South County often find this flexibility valuable.
Travis Ranch offers the most direct access to the 91 freeway of the three neighborhoods. For families with Riverside County commutes – and there are more of those than you’d expect given the housing price differential – this positioning saves meaningful time. The neighborhood is also closer to the Metrolink station in Anaheim Canyon, a route some commuters use for downtown LA connections. The 3:15 PM backup on Yorba Linda Boulevard during school dismissal affects all three neighborhoods equally, but Travis Ranch residents have more alternative routes to avoid it.
Who actually lives in these neighborhoods
Yorba Linda’s overall demographic profile skews affluent and established, with a median household income of $152,060 (Census Reporter, 2024), 15 – substantially above both state and national averages. The poverty rate of just 5.57 percent15 reflects the economic stability you’d expect from a community where median home prices exceed $1.4 million. The median age of 44.7 years15 suggests a mature population with established households rather than young professionals or retirees.
East Lake Village trends slightly younger and more family-oriented than the Yorba Linda average, with a higher share of households containing school-age children. The lake amenities attract families who prioritize weekend activities over pure investment appreciation. You’ll find more stay-at-home parents here than in some neighboring communities – the HOA-organized activities and community events create genuine social connections rather than the suburban isolation that characterizes some master-planned developments.
Bryant Ranch attracts families who’ve previously lived in Yorba Linda, perhaps in starter homes in other areas, and are upgrading within the same school district. The neighborhood has lower turnover than East Lake or Travis Ranch – people move here intending to stay through their kids’ graduation. This creates tight-knit blocks where neighbors actually know each other, but it also means fewer homes coming to market. When something is listed in Bryant Ranch, it tends to move quickly to buyers who’ve been waiting.
Travis Ranch has the most demographic diversity of the three, partly due to its wider price range. The townhome sections attract younger families and first-time buyers who want Yorba Linda schools without the $1.5 million entry point. The custom estate sections house executives and business owners who wish for space and privacy. This mix creates a different neighborhood character – less homogeneous, perhaps less intimate block-by-block, but with its own energy.
✅ Before You Tour: Drive the neighborhood at 8 AM on a school day and again at 3:30 PM. Park near the elementary school and watch drop-off or pickup. This tells you more about who actually lives there than any demographic report – and shows you traffic patterns that will affect your daily life for years.
Making the actual decision
Here’s how we typically frame this choice for families: East Lake Village makes sense if water recreation fits your lifestyle and you’re prepared for the higher upfront cost and ongoing HOA fees to maintain those amenities. The lakes aren’t a gimmick – families who use them love them. But if you tour the neighborhood, fall for the aesthetics, and then realize you’re paying $400/month extra for amenities you’ll use twice a year, you’ve bought the wrong house.
Bryant Ranch fits families who prioritize walkable elementary schools, equestrian-adjacent character, and established community bonds over resort amenities. The limited inventory means patience – you might wait months for the right property to list. But buyers who land here tend to stay, which tells you something about neighborhood satisfaction.
Travis Ranch serves families who want Yorba Linda-quality schools and amenities but need flexibility in their budget or floor plan requirements. The K-8 school model appeals to some families and doesn’t fit others – that’s a personal judgment call. The neighborhood’s proximity to freeway access suits commuters who’d otherwise spend significant time on surface streets.
None of these neighborhoods is objectively “best” – they serve different families with different priorities. The mistake we see most often is buyers choosing based on price point alone without experiencing how daily life actually works in each location. Before making an offer, spend time in all three. Walk the trails, drive the school routes, and check out the community amenities on a Saturday morning. The right choice becomes evident once you’ve lived it, even briefly.
How long do homes typically stay on the market in these Yorba Linda neighborhoods?
Market pace varies by neighborhood and property quality. East Lake Village homes average 43 days on market, though premium lakefront properties with updated finishes can go pending in 19-27 days when priced correctly (Redfin, October 2025)2. Bryant Ranch runs slightly slower at 53 days on average4 reflecting both limited inventory and buyers taking time to evaluate. Travis Ranch has accelerated to 43 days from 51 days the previous year6. In all three neighborhoods, well-priced homes in move-in condition sell significantly faster than the averages suggest.
Are there rental options in these neighborhoods for families wanting to try before buying?
Yes, though inventory is limited. East Lake Village has approximately 16 rental units available, ranging from $3,400 to $11,000 per month. Bryant Ranch and Travis Ranch each show around 11 rental units in the $2,700 to $6,500 monthly range3,4. These rentals tend to be single-family homes rather than apartments, and competition is intense. If you’re considering a rental to experience the neighborhood before purchasing, start your search early and be prepared to move quickly when you find something that meets your needs.
What should we know about HOA fees and Mello-Roos in these areas?
HOA fees vary significantly. East Lake Village HOAs typically charge higher dues than Bryant Ranch or Travis Ranch due to lake maintenance, community pools, and resort-style amenities; expect $300- 300-500+ monthly, depending on the specific association. Bryant Ranch and Travis Ranch HOAs typically charge $150-300 per month for standard community maintenance. Mello-Roos taxes apply to some newer construction sections, particularly in Travis Ranch developments built in the 2000s and 2010s. Always request a full breakdown of monthly carrying costs – base property taxes, HOA dues, Mello-Roos if applicable, and any special assessments – before making an offer.
How do these neighborhoods handle the summer heat?
Yorba Linda’s inland position means summer temperatures regularly exceed 90°F, sometimes reaching triple digits. East Lake Village families have obvious advantages here – the community pools and lake access provide built-in cooling options without leaving the neighborhood. Bryant Ranch and Travis Ranch residents typically rely on backyard pools (common in homes at these price points) or city recreation facilities. All three neighborhoods are close enough to the coast for beach day trips, though you’re looking at 30-45 minutes to reach Huntington or Newport, depending on traffic. Air conditioning is standard in virtually every home; if you’re touring a property without functioning AC, that’s a point of negotiation.

About Wendy Rawley
Wendy Rawley and her team specialize in Yorba Linda and North Orange County real estate, helping families navigate neighborhood decisions with data and local insight rather than marketing hype. With deep knowledge of school boundaries, HOA nuances, and street-by-street differences, the team matches buyers with neighborhoods that fit their actual lifestyle – not just their budget.
Ready to Tour East Lake Village, Bryant Ranch, or Travis Ranch?
Skip the generic neighborhood tours. We’ll show you the specific streets, school boundaries, and hidden details that matter for your family’s situation.
📚 Sources & References
1. Redfin – Yorba Linda Housing Market
Redfin | redfin.com | Accessed November 2025
Primary source for citywide median sale price ($1.4M), year-over-year appreciation (7.7%), days on market (41), and market competitiveness data. Redfin aggregates MLS data with proprietary transaction records for comprehensive market analysis.
📍 Source: https://www.redfin.com/city/20195/CA/Yorba-Linda/housing-market
2. Redfin – East Lake Village Market Data
Redfin | redfin.com | Accessed October 2025
Source for East Lake Village median listing prices ($1.8M September 2025), days on market (43), price per square foot ($853), sale-to-list ratios, and rental inventory (16 units, $3,400-$11,000/month). Used to establish East Lake Village as the premium-priced neighborhood among the three compared.
📍 Source: https://www.redfin.com/neighborhood/465844/CA/Yorba-Linda/East-Lake-Village/housing-market
3. Realtor.com – Travis Ranch Neighborhood
Realtor.com | realtor.com | Accessed December 2024
Source for Travis Ranch price range ($515,000-$3.5M), inventory count (67 homes), median listing price, and rental inventory data. Demonstrates the wide price diversity within Travis Ranch compared to more homogeneous neighborhoods.
📍 Source: https://www.realtor.com/realestateandhomes-search/Travis-Ranch_Yorba-Linda_CA
4. Realtor.com – Bryant Ranch Market Analysis
Realtor.com | realtor.com | Accessed September 2025
Primary source for Bryant Ranch’s 45.8% year-over-year appreciation rate, median listing price ($1.7M), days on market (53), and inventory levels (67 homes). This dramatic appreciation data supports the narrative of strong buyer competition in Bryant Ranch.
📍 Source: https://www.realtor.com/realestateandhomes-search/Bryant-Ranch_Yorba-Linda_CA
5. Redfin – Bryant Ranch Housing Market
Redfin | redfin.com | Accessed October 2025
Supplementary Bryant Ranch data showing 18.7% year-over-year increase and $1.6M median sale price. Used to corroborate Realtor.com data and provide transaction-based pricing versus listing-based pricing.
📍 Source: https://www.redfin.com/neighborhood/3192/CA/Yorba-Linda/Bryant-Ranch/housing-market
6. Redfin – Travis Ranch Housing Market
Redfin | redfin.com | Accessed October 2025
Source for Travis Ranch market pace improvement (43 days vs. 51 days previous year), 8.4% year-over-year appreciation, and $1.5M median sale price. Key data point showing accelerating sales velocity in this neighborhood.
📍 Source: https://www.redfin.com/neighborhood/6074/CA/Yorba-Linda/Travis-Ranch/housing-market
7. Niche – Placentia-Yorba Linda Unified School District
Niche | niche.com | Accessed 2024
Authoritative source for district-wide data: A+ overall rating, 23,138 students, 33 schools, 94% graduation rate, 1,300 average SAT, 29 average ACT. Niche aggregates state test scores, college readiness data, and parent/student reviews.
📍 Source: https://www.niche.com/k12/d/placentia-yorba-linda-unified-school-district-ca/
8. GreatSchools – Bryant Ranch Elementary
GreatSchools | greatschools.org | Accessed 2024
Source for Bryant Ranch Elementary’s 9/10 GreatSchools rating and academic performance data. GreatSchools ratings incorporate state test scores, student progress, and equity metrics.
📍 Source: https://www.greatschools.org/california/yorba-linda/8622-Bryant-Ranch-Elementary-School/
9. GreatSchools – Fairmont Elementary
GreatSchools | greatschools.org | Accessed 2024
Source for Fairmont Elementary’s 9/10 rating serving East Lake Village families. Used to establish comparable elementary school quality across neighborhoods.
📍 Source: https://www.greatschools.org/california/yorba-linda/fairmont-elementary/
10. GreatSchools – Lakeview Elementary
GreatSchools | greatschools.org | Accessed 2024
Source for Lakeview Elementary’s 8/10 rating. Referenced to illustrate that school boundaries within East Lake Village may assign students to different elementary campuses.
📍 Source: https://www.greatschools.org/california/yorba-linda/lakeview-elementary/
11. GreatSchools – Travis Ranch School
GreatSchools | greatschools.org | Accessed 2024
Source for Travis Ranch School’s 7/10 rating and K-8 configuration. Key differentiator showing this neighborhood’s unique educational model compared to traditional elementary/middle school separation.
📍 Source: https://www.greatschools.org/california/yorba-linda/travis-ranch/
12. GreatSchools – Yorba Linda High School
GreatSchools | greatschools.org | Accessed 2024
Source for YLHS’s perfect 10/10 rating, 99% graduation rate, 1,584 students, 3.68 average GPA, and 1,320 average SAT scores. Establishes that all three neighborhoods feed into the same excellent high school.
📍 Source: https://www.greatschools.org/california/yorba-linda/yorba-linda-high/
13. City of Yorba Linda – Trails System
City of Yorba Linda | yorbalindaca.gov | Accessed 2024
Official source for the city’s 100+ mile trail network and connections to Carbon Canyon Regional Park, Chino Hills State Park, Orange County Santa Ana River Trail, and Yorba Regional Park.
📍 Source: https://www.yorbalindaca.gov/trails
14. City of Yorba Linda – Parks & Recreation
City of Yorba Linda | yorbalindaca.gov | Accessed 2024
Source for city recreation programming including youth sports, aquatics, facility rentals, preschool programs, and senior services serving all Yorba Linda neighborhoods.
📍 Source: https://www.yorbalindaca.gov/parks-recreation
15. Census Reporter – Yorba Linda Demographics
Census Reporter | censusreporter.org | Accessed 2024
Source for Yorba Linda demographic data: $152,060 median household income, 5.57% poverty rate, 44.7 median age, and 66,489 population. Census Reporter synthesizes American Community Survey data.
📍 Source: https://censusreporter.org/profiles/16000US0687042-yorba-linda-ca/
Disclaimer: The information provided in this article is for educational and informational purposes only. Real estate markets are dynamic and subject to change. Prices, statistics, and market conditions cited are accurate as of the date of publication but may have changed since. While we strive to provide accurate and up-to-date information, we make no representations or warranties of any kind, express or implied, about the completeness, accuracy, reliability, or suitability of the information contained herein. Any reliance you place on such information is strictly at your own risk. School boundaries and ratings change periodically; verify current assignments directly with Placentia-Yorba Linda Unified School District before making purchase decisions. For the most current market data and personalized advice, please contact The Wendy Rawley Team directly at (714) 746-6355.