Yorba Linda Home Comps Analysis 2026: Price to Sell in Under 30 Days or Maximize Profit?
![]()
Yorba Linda Home Comps Analysis 2026: Price to Sell in Under 30 Days or Maximize Profit?
A data-driven look at how Yorba Linda sellers can choose between speed and top dollar in spring 2026.
Quick Answer
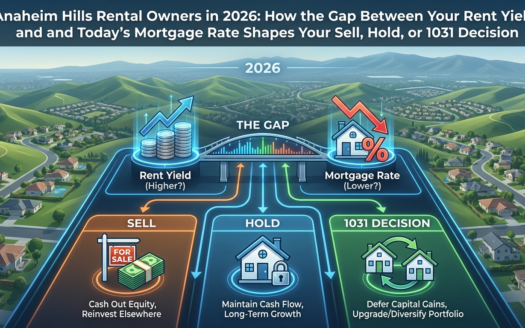
Homes in Yorba Linda sell in a median of 36 days, based on recent Redfin data, while listings priced above recent comps routinely take 60+ days and often require price reductions. For most Yorba Linda sellers in spring 2026, pricing at or slightly below the comp range (Strategy A) is the most reliable path to a strong sale. But if your home has genuine premium features (a protected view in Kerrigan Ranch, a documented renovation, a true cul-de-sac lot in Vista del Verde) and you can absorb 60-90 days of carrying costs, pricing at the top of comps (Strategy B) can still work.
The directional call: Strategy A (price within comp range to sell in under 30 days) fits most Yorba Linda sellers right now. Strategy B (price at the top of comps) fits sellers with a demonstrably above-market home and real flexibility on the timeline.
The Yorba Linda Home Pricing Dilemma: Why Getting It Wrong Costs You Either Way
Pricing your Yorba Linda home in Yorba Linda, California (Orange County), for spring 2026 means choosing between two real financial risks: leaving money on the table by underpricing, or watching your home sit while the market moves past you. Both mistakes are quantifiable and show up clearly in what we’re seeing in current listings.
The current Redfin median sale price in Yorba Linda is $1,332,000.1. Homes in Yorba Linda sell with a median of 36 days, according to recent Redfin data.1 That 36-day median is the middle of the market. Properties priced in line with recent comps typically move within that window, while listings priced above the comp range routinely stretch to 60, 75, or 90+ days before closing, usually after one or more price reductions. Redfin reports that 20.2% of Yorba Linda listings had a price drop in the most recent period.1
Prices have declined by approximately 2.8% year over year, according to recent Redfin data. This reflects recent trends and may not continue. Yorba Linda currently has 119 active listings, with 1.8 months of supply and an average sale-to-list ratio of 100.7%.1
At the current 6.30% 30-year rate3 and a typical Yorba Linda mortgage, each additional week on market adds roughly $1,500-$2,000 in carrying costs (P&I, taxes, insurance, utilities), and every 30 days past the median DOM materially increases the probability of a price reduction.1
The buyer side of this equation matters too. At 6.30% mortgage rates3, a conventional buyer putting 20% down on a $1,332,000 Yorba Linda home faces roughly $6,596 per month in P&I alone, before taxes and insurance push the total monthly cost into the $7,900-$8,200 range. Buyers at this price point are rate-sensitive and comp-sensitive. They run the same analyses you do, and they walk away from listings that look 3-5% over-market. Context matters: the median household income in Yorba Linda is $157,582, according to Census Bureau ACS data2 but most move-up buyers at the $1.3M+ price point are dual-income households well above that figure. Before you set your price, pull a hyper-local comp analysis of the three most recent closed sales within half a mile of your front door. That tight radius is what today’s buyer’s agent is looking at.
Why the Old Playbook Fails: Traditional Pricing in a Shifting Market
The conventional advice, “Price high so you have room to negotiate,” fails in spring 2026 Yorba Linda because buyers and their agents have better data than they did three years ago, and the market is no longer forgiving of anchor pricing. Year-over-year prices are down roughly 2.8%1, which means comps from six or twelve months ago are actively misleading.
🏠 Yorba Linda Market Snapshot
Three traditional playbook mistakes recur in current Yorba Linda listings that stall. First, pricing off stale comps: a home that sold for $1M in summer 2025 is not a valid comp for a spring 2026 listing at the same price point, because the market has softened by the single-digit YoY figure above. Second, relying on automated value estimates like Zestimates, which blend public records, tax assessments, and algorithmic adjustments without visibility into the condition, upgrades, or view premium of neighboring comps. Third, using “list high, reduce later” as a strategy. The 20.2% price-drop rate1 confirms that this approach is common, but price reductions signal weakness to buyers and their agents, and the final sale price after a reduction is almost always lower than that of a home priced correctly from day one. If you’re weighing pre-sale upgrades to justify a stronger price, the National Association of Home Builders publishes useful home improvement ROI research on which projects actually return their cost at resale.
The gap between the Census-reported owner-estimated value and actual transaction prices also matters for context. The Census Bureau reports a median home value of $1,147,100 for Yorba Linda (based on owner-reported ACS survey data, which typically lags current transaction prices).2 The $185,000 gap between Census ($1,147,100) and current Redfin transaction medians ($1,332,000) reflects how rapidly values moved through 2022-2024, and why owners who bought before 2020 sometimes underestimate current value, while owners who bought at the 2022 peak sometimes overestimate it.
The Smarter Approach: How to Read Yorba Linda Home Comps Like a Pro in Spring 2026
Our data-driven framework for pricing a Yorba Linda home in spring 2026 starts by choosing between two clear strategies, each with predictable DOM and sale price outcomes. The right choice depends on your timeline, your carrying cost tolerance, and whether your home has genuine premium features that justify an above-market ask.
Median price per square foot in Yorba Linda currently runs at $6191, which sits between Brea (~$603) and Orange (~$649) and closely matches Placentia (~$619). That PPSF figure is a starting anchor, but the real work is adjusting for lot size, view, upgrades, and neighborhood tier within Yorba Linda itself.
Strategy A: Price at or Slightly Below Market Comps to Sell in Under 30 Days
Strategy A prices the home at or 1-3% below the midpoint of recent closed comps, targeting a sale within 14-30 days and often above list. Current data supports this approach: 50.8% of Yorba Linda homes sold above their list price in the most recent period1, and the average sale-to-list ratio of 100.7%1 confirms that competitively priced homes are drawing multiple offers rather than settling below ask. With 1.8 months of supply, Redfin data indicates Yorba Linda currently leans toward a seller’s market, based on recent inventory levels1 and well-priced listings are still generating competition. Expected outcome: under 30 days on market, final sale 100-103% of list, low price-reduction risk. Trade-off: You may leave 1-2% of upside on the table versus a perfectly executed Strategy B.
Strategy B: Price at the Upper Range of Comps to Maximize Sale Price
Strategy B prices at the top 5-8% of the comp range, targeting a single well-qualified buyer willing to pay a premium for a specific feature set: a view lot, a recent high-end renovation, a premium cul-de-sac location, or genuinely rare inventory in neighborhoods like Kerrigan Ranch or Vista del Verde. This only works when the home has objectively above-market features that can be documented for appraisal. Expected outcome: 45-90+ days on market, one price reduction possible (the 20.2% drop rate1 reflects this group disproportionately), final sale typically 95-100% of original list. Trade-off: longer DOM means roughly $6,000-$8,000+ per month in total carrying costs (P&I, taxes, insurance, maintenance), and the risk of appraisal shortfalls if your buyer is financed. Strategy B makes sense when you have time flexibility, strong carrying-cost capacity, and a home that genuinely merits a premium—not when you just want to “try it high first.”
Your Spring 2026 Pricing Game Plan: Step by Step from Comps to Closing
Your Yorba Linda spring 2026 pricing sequence runs from comp analysis through listing launch to closing in a roughly 60-90 day window, with specific decision points calibrated to current market data. The plan below assumes an April-June 2026 listing window within the current market momentum.
Step 1: Pull True Comps—Last 90 Days, Same Sub-Market, Adjusted
Pull closed comps from the last 90 days within your specific Yorba Linda sub-market (Travis Ranch, East Lake Village, Bryant Ranch, Kerrigan Ranch), not city-wide. Adjust each comp for square footage, lot size, view, upgrades, and days on market. A comp that sold after 65 days with a price reduction should be treated differently from one that sold in 12 days above the list. Walk Score tier matters too. Main Street/Town Center comps (Walk Score 28)5 are not interchangeable with Black Gold/Hidden Hills comps (Walk Score 2)6. Across our 80 Yorba Linda transactions since 2012, pulling broad city-wide comps is the single most common pricing mistake we see sellers make before hiring an agent.
Step 2: Choose Your Strategy Before You List
Decide between Strategy A and Strategy B before the sign goes in the ground, not after week two. Strategy A suits most sellers: homes priced accurately against current comps are supported by the 100.7% sale-to-list ratio1 and the 75-pending-to-71-new-listings absorption pattern1. Strategy B suits sellers with documented premium features and a 60-90-day carrying-cost tolerance. There are real situations where Strategy B makes sense even in a comp-sensitive market: a recent full renovation with permits, a protected hillside view in Kerrigan Ranch, a true lakefront position in East Lake Village, or a unique floor plan. But the bar is higher than most sellers assume. If your renovation involves unpermitted work, pull the permit history and consult the city’s Building Permits resources before you list, because unresolved permit issues regularly derail escrow.
Step 3: Listing Launch, Act Within the Current Momentum
Once your price is set and the home is prepped, list while momentum is strong rather than waiting for a specific future month. Spring typically brings increased buyer activity, and the current inventory at 119 active listings1 against 75 pending sales signals real buyer engagement right now. Front-load your marketing (professional photography, twilight shots, drone footage for hillside or view properties, full MLS syndication, and a pre-list broker preview) in the first 72 hours. The bulk of serious showing activity happens in the first 10-14 days on market, which is also the window when you’re most likely to receive at- or above-list offers. One practical note: Southern California buyers expect smooth indoor-outdoor flow, so pool condition and patio staging directly move offer prices. If you’re hiring contractors for last-minute prep, the FTC’s guidance on how to avoid home repair scams is worth a quick read before you sign anything.
Step 4: Week 2 Check-In, How to Read the Signals
At the 14-day mark, evaluate showing activity and offer flow against benchmarks. Strong signal: 10+ showings, 2+ offers, or consistent second showings. Hold firm on price. Weak signal: fewer than 5 showings, no offers, no repeat visits. The market is telling you the price is 2-4% too high, and a decisive reduction early outperforms three small reductions later. The 20.2% price-drop rate1 largely reflects sellers who waited too long to adjust. Pending closings typically run 30-45 days after acceptance, which puts an April listing at a late May through early July close.
Your Next Steps
- Get a sub-market-specific CMA: Ask us for a comparative market analysis that uses comps from your specific Yorba Linda neighborhood within the last 90 days, not city-wide medians. This is the single most important input for correctly pricing your Yorba Linda home.
- Choose your strategy before listing: Decide between Strategy A (comp-range pricing, under-30-day sale) and Strategy B (top-of-comps pricing, 45-90 day window) based on your timeline and carrying-cost tolerance.
- Prep aggressively in the first 72 hours: professional photography, a staging review, and a pre-list marketing push capture the peak buyer attention window that defines your final sale price.
- Set a 14-day checkpoint: Agree with us in advance on what showing and offer counts will trigger a price reduction. Decisive early adjustments outperform slow drift every time.
Data in this article is sourced from Redfin (updated monthly), Freddie Mac PMMS, U.S. Census Bureau ACS, and HUD Fair Market Rent data. This article was last updated on 2026-04-20.
Ready to Sell Your Yorba Linda Home?
With 190 sales across North Orange County, we know exactly how smart preparation impacts your sale price. Let’s create a customized strategy for you.
📞 Call (714) 746-6355🌐 Visit go2wendy.com
Serving Yorba Linda and North Orange County since 2011 | DRE #01898824

Wendy Rawley
REALTOR® | DRE #01898824
Wendy Rawley and The Wendy Rawley Team at First Team Real Estate have helped hundreds of North Orange County families through their real estate decisions. With deep local expertise in Yorba Linda and the surrounding communities, Wendy provides personalized guidance for every client.
📍 Office: First Team Real Estate, 18180 Yorba Linda Blvd, Suite 501, Yorba Linda, CA 92886
📞 Phone:(714) 746-6355
🌐 Website:go2wendy.com
Serving: Yorba Linda, Placentia, Brea, Fullerton, Anaheim Hills, Anaheim, La Habra, Orange
Sources & Data
1Redfin – Yorba Linda Housing Market Data
URL: https://www.redfin.com/city/21006/CA/Yorba-Linda/housing-market
Comprehensive housing market statistics, including median sale prices, inventory levels, days on market, and year-over-year trends for Yorba Linda properties as of 2026-03-31.
2U.S. Census Bureau – American Community Survey
URL: https://data.census.gov/profile?g=160XX00US0686832
Demographic data, including population (67170), median household income ($157582), and housing characteristics from the ACS 5-Year Estimates.
3Freddie Mac – Primary Mortgage Market Survey (via FRED)
URL: https://fred.stlouisfed.org/series/MORTGAGE30US
Current mortgage rate data: 30-year fixed at 6.30% and 15-year fixed at 5.65% as of 2026-04-16.
4City of Yorba Linda – Community Development
URL: https://www.yorbalindaca.gov/164/Community-Development
Community development department with planning and zoning resources.
5Walk Score – Main Street / Town Center (Yorba Linda)
URL: https://www.walkscore.com/score/Yorba-Linda-CA/lat=33.892/lng=-117.78/?utm_source=go2wendy.com&utm_medium=ws_api&utm_campaign=ws_api
Main Street / Town Center walkability: Walk 28/100, Bike 47/100. Coordinate-specific measurement from the WalkScore API.
6Walk Score – Black Gold / Hidden Hills (Yorba Linda)
URL: https://www.walkscore.com/score/Yorba-Linda-CA/lat=33.9105/lng=-117.7355/?utm_source=go2wendy.com&utm_medium=ws_api&utm_campaign=ws_api
Black Gold / Hidden Hills walkability: Walk 2/100, Bike 1/100. Coordinate-specific measurement from the WalkScore API.
School data provided by GreatSchools.org © 2026. All rights reserved.
Disclaimer: This article is for informational purposes only and does not constitute legal, tax, financial, or mortgage lending advice. Real estate commissions are negotiable and vary by brokerage. Mortgage rates, terms, and qualification criteria vary by lender and change frequently. Real estate markets fluctuate, and individual circumstances vary. Consult qualified professionals, including a licensed mortgage loan originator, regarding your specific situation. The Wendy Rawley Team | First Team Real Estate | DRE #01898824.
Equal Housing Opportunity.