Best North OC Rental Property Investment 2025
![]()
Best North Orange County Areas to Invest in Rental Property in 2025
Anaheim, Fullerton, and Orange: Which City Delivers the Best Returns?
You’ll discover which North Orange County city offers the strongest rental yields, lowest vacancy rates, and best long-term appreciation for your investment portfolio.
By The Wendy Rawley Team REALTORS® | DRE #01898824
Published: December 2025 | Updated for Current Market
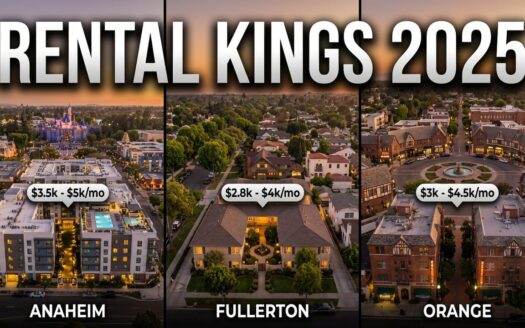
💡 Bottom Line Up Front: Anaheim offers the lowest entry price at around $910,0001 with the highest rental yields – traditional rentals average $2,763 monthly while short-term vacation rentals near Disneyland pull in $4,1212. Fullerton sits in the middle at $980,000-$1.1M3 with stable demand from Cal State Fullerton students and professionals. Orange commands the highest prices at $1.1M4 but attracts quality tenants in an affluent market. Orange County’s multifamily vacancy rate sits at just 4.0%5 – the second-lowest in the nation – while rental property investors can expect cap rates around 4.4%6.
You’re looking at rental property investments in North Orange County, and the choices can feel overwhelming. Anaheim promises tourism-driven income near Disneyland. Fullerton offers university-adjacent stability. Orange delivers Old Towne charm with higher-income tenants. But which one actually puts more money in your pocket?
Here’s the reality: all three cities compete for your investment dollars, but they don’t compete equally. Entry prices differ by $200,000 or more. Rental yields vary dramatically depending on whether you’re targeting long-term tenants or short-term vacationers. Property taxes, tenant quality, vacancy rates, and appreciation potential – these aren’t just numbers on a spreadsheet. They’re the difference between a property that funds your retirement and one that drains your savings.
This isn’t about generic market statistics or wishful thinking. We’re comparing actual median home prices, verified rental rates, measurable vacancy data, and real-world investment metrics. You’ll see where your down payment goes furthest, which neighborhoods fill fastest, and how California’s rent control laws affect your bottom line. By the time you finish reading, you’ll know exactly which North Orange County city matches your investment strategy – and which ones you should avoid.
🏠 Anaheim: Tourism-Driven Income with Lower Entry Costs
Anaheim sits at the sweet spot for investors who want cash flow without breaking the bank on acquisition costs. You’re looking at median home prices around $910,0001 – which is roughly $70,000-$190,000 less than Fullerton or Orange. That’s a substantial difference when you’re calculating your down payment or comparing multiple properties.
But here’s what really matters: rental income potential. Traditional long-term rentals in Anaheim average $2,763 monthly2. That’s solid, but it gets better. If you’re positioned near Disneyland and the property qualifies for short-term rentals, you’re looking at an average monthly income of $4,1212. That’s a 49% increase over traditional rentals – though it comes with higher management costs and more hands-on oversight.
The numbers work because Anaheim’s renter population is massive. About 55.4% of residents rent7, creating consistent demand whether you’re targeting families, young professionals, or tourists. The city’s vacancy rate sits at just 4.5%8, meaning well-priced properties don’t sit empty for long.
Long-Term Appreciation Potential
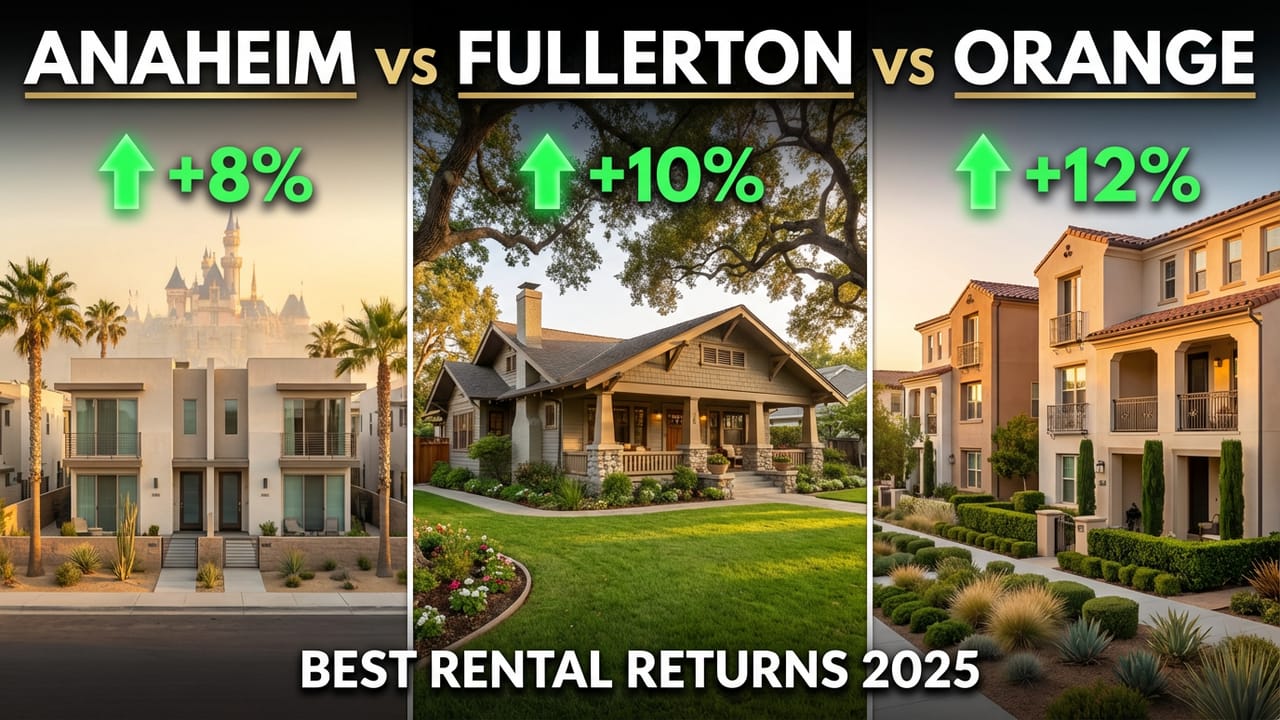
You’re not just buying for today’s cash flow – you’re betting on tomorrow’s equity. Anaheim’s 10-year appreciation rate is 7.2%9, which outpaces many California markets. Home values surged 12.1% in a single year10, though that pace has moderated with rising interest rates. Still, the median sale price hit $945,000 in October 202410, demonstrating sustained demand even during cooling periods.
The $4 billion OCVibe development around Honda Center is reshaping the Platinum Triangle, bringing apartments, offices, hotels, and entertainment venues11. Parking structures opened in 2025, signaling the project’s momentum. For investors, this means properties near these developments could see accelerated appreciation as the area transforms into a high-density mixed-use neighborhood.
| Metric | Anaheim | Investor Advantage |
|---|---|---|
| Median Home Price | $910,000 | Lowest entry cost in North OC |
| Long-Term Rent | $2,763/month | High traditional rental income |
| Short-Term Rent | $4,121/month | 49% premium near Disneyland |
| Vacancy Rate | 4.5% | Tight market, quick tenant placement |
| Renter Population | 55.4% | Most extensive renter base in comparison |
💡 What This Means for You:
Anaheim works best if you want the highest rental yields at the lowest entry price. Short-term rental strategies near Disneyland can significantly boost income, but they require active management or professional property management. If you’re buying for cash flow and plan to hold for appreciation, Anaheim offers the most potent combination in North Orange County.
🎓 Fullerton: Stable Demand from Students and Professionals
Fullerton occupies the middle ground between Anaheim’s tourism market and Orange’s affluent buyers. Median home prices range from $980,000 to $1.1 million3 depending on neighborhood and property type. You’re paying more than Anaheim but getting a different tenant profile – one that’s often more stable and less transient.
The Cal State Fullerton effect is real. The university enrolls over 40,000 students, creating consistent demand for rentals near campus. But here’s the key: you’re not just renting to undergrads. Faculty, staff, and young professionals employed by nearby employers account for much of the rental market. Average rents sit around $2,120-$2,53712, which is lower than Anaheim’s top-tier vacation rentals but more predictable over time.
About 48% of Fullerton residents rent13, providing a substantial tenant pool. Properties typically sell in 56 days14, suggesting moderate competition – fast enough to confirm demand, slow enough that you’re not bidding against a dozen other investors.
What You’re Actually Paying For
Fullerton’s premium over Anaheim buys you a different market dynamic. The city isn’t as tourism-dependent, so rental income remains steadier during economic downturns. When Disney slows or conventions cancel, Anaheim’s short-term rental market feels it immediately. Fullerton’s traditional rentals continue to perform well because people still need housing near work and school.
The median sale price hit $1.1 million in July 2025, up 11.6% year-over-year15. That’s a stronger appreciation than Anaheim during the same period, though it comes with higher acquisition costs. Homes receive an average of 2 offers16, indicating competitive but not frenzied bidding.
💪 Your Next Steps:
Focus on properties within 2 miles of Cal State Fullerton or near downtown Fullerton. These areas maintain occupancy even during summer months when students leave. Look for 2-3 bedroom homes or multi-unit properties that can accommodate roommates or small families. Pre-qualify your financing before touring – Fullerton’s market moves slower than Anaheim but faster than you’d expect.
| Metric | Fullerton | Investor Advantage |
|---|---|---|
| Median Home Price | $980K-$1.1M | Mid-range pricing with stability |
| Average Rent | $2,120-$2,537/month | Consistent income, less volatility |
| Days on Market | 56 days | Time to negotiate, fewer bidding wars |
| Renter Population | 48% | Strong rental demand |
| YoY Appreciation | 11.6% | Strongest recent appreciation |
🌳 Orange: Premium Pricing for Higher-Income Tenants
Orange represents the top tier of rental investments in North Orange County. You’re paying around $1.1 million4 for median properties – roughly $200,000 more than Anaheim and slightly above Fullerton. That premium buys access to affluent tenants, well-maintained neighborhoods, and the historic Old Towne district.
Average rents hit $2,799 monthly17, which is higher than both competitors. But here’s the trade-off: only 42% of Orange residents rent17 – the lowest percentage among the three cities. You’re fishing in a smaller tenant pool, but those tenants typically have higher credit scores, steadier employment, and longer lease terms.
Properties sell in about 43 days18 – faster than Fullerton but not as frenzied as Anaheim’s hottest neighborhoods. Home prices rose 2.9% year-over-year18, showing steady but not explosive appreciation. This is wealth preservation territory – you’re buying for stable, quality income rather than maximum cash flow.
The Old Towne Factor
Orange’s historic Old Towne district creates a unique investment dynamic. Properties near the Plaza command premium rents because tenants value walkability, charm, and proximity to restaurants and shops. You’re not competing on price alone – you’re offering a lifestyle that commands higher rents from professionals who can afford to pay for it.
The downside? When vacancies occur, they take longer to fill because you’re targeting a narrower demographic. Your property needs to be well maintained and competitively priced, or it’ll sit while tenants choose alternatives in Fullerton or Anaheim, where their dollar goes further.
⚠️ Important Consideration:
Orange works best for investors who prioritize tenant quality over maximum yields. You’ll screen fewer applicants but deal with fewer problems – late payments, property damage, and turnover all decrease with higher-income tenants. However, if a recession hits, these tenants are often the first to relocate for better job opportunities, leaving you with more extended vacancy periods.
| Metric | Orange | Investor Advantage |
|---|---|---|
| Median Home Price | $1.1M | Premium market positioning |
| Average Rent | $2,799/month | Highest rental rates |
| Days on Market | 43 days | Moderate competition |
| Renter Population | 42% | Smaller but higher-quality pool |
| YoY Appreciation | 2.9% | Steady, sustainable growth |
📊 Side-by-Side Investment Comparison
Let’s cut through the noise and look at what really matters when you’re writing that down payment check. You need to know how these three cities stack up on the metrics that affect your monthly cash flow, your tax bill, and your long-term wealth building.
Orange County’s overall multifamily market provides context for all three cities. The vacancy rate sits at 4.0%5 – the second-lowest in the nation. That’s investor-friendly territory because your properties won’t sit empty between tenants. Cap rates average around 4.4%6 for multifamily properties, reflecting strong investor confidence in the market’s fundamentals.
Property taxes in Orange County run about 1.14% of assessed value19, though this varies by specific tax rate area. For a $1 million property, you’re looking at roughly $11,400 annually in property taxes before any exemptions. This is higher than the national average but typical for Southern California.
Calculating Your Real Returns
Here’s where the rubber meets the road. Let’s assume you’re buying a $1 million property with 25% down ($250,000) and financing $750,000 at current rates. Your monthly expenses include mortgage, property taxes, insurance, HOA fees (if applicable), and maintenance reserves.
In Anaheim, you’re collecting $2,763 per month from a traditional rental or $4,121 from a short-term rental. Your property cost you $910,0001, so you’re putting down $227,500 and financing $682,500. The lower entry price means lower monthly mortgage payments – roughly $4,000-$4,500 depending on your interest rate. With traditional rentals, you’re likely to experience slight negative cash flow initially, relying on appreciation. With short-term rentals, you can achieve positive cash flow by maintaining high occupancy.
In Fullerton, your $980,000-$1.1M purchase3 generates $2,120-$2,537 monthly12. You’re almost certainly running negative cash flow in the early years, especially at the higher end of that price range. But you saw 11.6% appreciation last year15, which builds equity faster than rental income.
In Orange, you’re all-in at $1.1M4 but collecting $2,799 monthly17. Your cash flow calculation looks similar to Fullerton’s, but you’re betting on tenant quality reducing turnover costs and maintenance headaches. If your property stays rented 95% of the time versus 85% in a more volatile market, that 10% difference adds up over a decade.
| City | Entry Price | Monthly Rent | Best For |
|---|---|---|---|
| Anaheim | $910,000 | $2,763-$4,121 | Maximum cash flow, tourism leverage |
| Fullerton | $980K-$1.1M | $2,120-$2,537 | Stable tenants, strong appreciation |
| Orange | $1.1M | $2,799 | Quality tenants, wealth preservation |
⚖️ California Rent Control and Investor Protections
You need to understand AB 1482 before you sign any purchase agreement. California’s Tenant Protection Act caps annual rent increases at 5% plus the Consumer Price Index (CPI), with a maximum of 10%20. For Orange County in the 2025-2026 period, that means increases are capped at 8%21.
Here’s what that means for your rental strategy: if you buy a property with below-market rents, you can’t immediately jack them up to market rate unless the property is vacant. Vacancy decontrol remains intact22, so you can reset to market rate when all original tenants vacate. But while they’re living there, your annual increases are limited.
The law applies to most rental properties but exempts new construction built within the last 15 years and single-family homes not owned by corporations23. If you’re buying newer properties in Anaheim’s developing areas or single-family homes under an LLC structure, verify your exemption status before assuming you can raise rents freely.
Local Rent Control Variations
Santa Ana is the only city in Orange County with its own stricter rent control ordinance, capping increases at 3% annually for covered properties24. Anaheim, Fullerton, and Orange don’t have citywide rent control beyond AB 1482, though Fullerton has agreements with some property owners restricting rents on specific affordable housing developments25.
For investors, this regulatory environment actually provides predictability. You know your maximum rent increases in advance. You can model your cash flow projections with confidence that the rules won’t change mid-lease. And if you’re strategic about tenant selection and property improvements, you can justify market-rate rents during vacancy turnover.
💡 What This Means for You:
Factor AB 1482 into your underwriting. If a property is rented at $2,000 monthly but the market rate is $2,800, you can’t immediately jump to the market rate. Plan for 2-3 years of capped increases to reach the market, or wait for tenant turnover. Properties with current tenants at below-market rents are riskier unless you’re confident they’ll vacate within 12-24 months.
🎯 Making Your Investment Decision
You’ve seen the numbers. Now let’s discuss which city makes the most sense for your specific situation. There’s no universal “best” choice – it depends on your capital, your risk tolerance, and whether you’re managing properties yourself or hiring it out.
Choose Anaheim if you’re maximizing cash flow and you’re comfortable with active management. The lower entry price ($910,0001) means your down payment goes further, and the short-term rental opportunity near Disneyland can generate 49% more income than traditional rentals2. But you’re taking on more work – short-term rentals mean cleaning, check-ins, and constant guest communication. If you’re buying multiple properties or want hands-off ownership, management costs quickly eat into those higher rents.
Choose Fullerton if you want stable long-term appreciation with moderate cash flow expectations. You’re paying more upfront ($980,000-$1.1M3), but you saw 11.6% appreciation last year15. The university creates consistent tenant demand that doesn’t fluctuate with tourism trends. This is the sweet spot for investors who plan to hold for 10+ years and prioritize equity buildup over immediate cash flow.
Choose Orange if tenant quality matters more than maximum yields. At $1.1M4, you’re paying a premium, but you’re also screening from a pool of higher-income tenants who cause fewer problems. If you’re managing properties remotely or want to minimize late-night maintenance calls, the extra $200,000 in purchase price could save you $20,000 in headaches over five years.
💪 Your Next Steps:
Run your own numbers with current mortgage rates and your actual down payment. Use conservative rent estimates – assume 85% occupancy, not 95%—factor in 1% annually for maintenance and repairs. If the math works with these conservative assumptions, you’ve got a solid investment. If you’re banking on perfect occupancy and no repairs to break even, you’re one tenant away from financial stress.
❓ Frequently Asked Questions About North OC Rental Property Investment
What’s the typical cap rate for rental properties in Anaheim, Fullerton, and Orange?
Orange County multifamily properties average cap rates around 4.4%6, which is typical for high-demand Southern California markets. Single-family rentals in these three cities often show lower cap rates (3-4%) because you’re buying for appreciation as much as income. If you’re seeing cap rates below 3%, you’re paying a significant premium for location or condition – make sure the appreciation potential justifies it.
How much should I budget for property taxes on a $1 million rental property?
Orange County’s effective property tax rate is approximately 1.14%19, though specific rates vary by tax rate area. For a $1 million property, budget around $11,400 annually. This doesn’t include Mello-Roos or special assessments, which can add 0.5-1% in some newer developments. Check the specific tax rate area before closing – properties blocks apart can have significantly different tax bills.
Can I raise rents freely in Orange County, or are there restrictions?
AB 1482 caps annual rent increases at 5% plus CPI, or 10% maximum, whichever is lower20. For 2025-2026, that’s an 8% cap in Orange County21. The law applies to most properties over 15 years old, though single-family homes not owned by corporations may be exempt23. You can reset rents to market rate once all original tenants vacate, so vacancy turnover occurs when you recoup below-market rents.
Is it better to buy near Disneyland for short-term rentals or focus on traditional long-term tenants?
Short-term rentals near Disneyland generate 49% more income on average ($4,121 vs. $2,763 monthly2), but they require significantly more management. You’ll pay 20-30% of gross rents to a property manager, or spend hours each week handling bookings, coordinating cleaning, and addressing guest issues. Traditional long-term rentals offer steadier, more passive income. If you’re managing one property yourself, short-term can work. If you’re building a portfolio of multiple properties, traditional rentals scale better.
How long do properties typically take to sell in these three cities?
Orange moves fastest at 43 days on market18, followed by Fullerton at 56 days14. Anaheim varies widely by neighborhood – properties near Disneyland can sell in under 30 days, while areas further from attractions take 40-50 days. These timeframes reflect moderate competition, not the frenzied bidding wars of 2021-2022. You’ll have time to inspect and negotiate, but don’t expect properties to sit for months while you deliberate.
✅ Final Thoughts: Matching Your Investment Strategy to the Right City
Here’s what you’ve learned: Anaheim offers the highest rental yields at the lowest entry price, Fullerton provides stable university-driven demand with strong appreciation, and Orange delivers premium tenants at premium prices. None of these cities is objectively “best” – they’re different tools for different investment strategies.
The mistake most investors make is chasing the highest advertised rental rates without factoring in management complexity, vacancy patterns, or tenant quality. Yes, Anaheim’s short-term rentals can generate $4,121 monthly, but only if you’re prepared to manage the logistics or pay someone 25-30% of that income to do it for you. Fullerton’s lower rents might frustrate you until you realize you haven’t had a vacancy in three years because Cal State creates constant tenant demand. Orange’s high purchase price may seem excessive until you experience your first tenant who pays on time, maintains the property, and renews for five consecutive years.
The North Orange County rental market isn’t going to hand you easy money. With vacancy rates at 4.0%5 and rent control capping your annual increases at 8%21, this is a market that rewards careful analysis and disciplined underwriting. Buy in the right location with realistic expectations, and you’re building long-term wealth. Buy impulsively chasing short-term cash flow, and you’re one bad tenant or market downturn away from selling at a loss.
Your next move isn’t to rush into the first property you can afford. It’s to run your numbers conservatively, compare your actual financing costs against realistic rental income, and understand which of these three cities aligns with your investment timeline and management capacity. The best investment is the one that matches your specific situation – not someone else’s success story from 2020.

About Wendy Rawley
Wendy Rawley has served North Orange County homebuyers and sellers for over 15 years, specializing in Anaheim, Fullerton, and Orange. Her team has helped hundreds of investors navigate competitive markets, analyze rental yields, and build profitable real estate portfolios.
Her expertise in North Orange County neighborhoods means you get insider knowledge of rental market dynamics, tenant demographics, and appreciation patterns that directly impact your investment returns. When you work with The Wendy Rawley Team, you’re partnering with local experts who understand the real differences between investment opportunities – not just generic market statistics.
📞 (714) 746-6355
✉️ wendy@go2wendy.com
DRE #01898824
📞 Ready to Analyze Your North OC Investment Opportunities?
You need accurate rental comps, realistic cash flow projections, and insider knowledge of which neighborhoods deliver the best returns. The Wendy Rawley Team provides investor-focused analysis that shows you exactly which properties make financial sense – and which ones to avoid. Contact us today for a free investment property consultation tailored to your budget and strategy.
📞 Call/Text: (714) 746-6355
✉️ Email: wendy@go2wendy.com
Available 7 days a week | Free consultation | No pressure
📚 Sources & References
1. Rocket Homes – Anaheim Housing Market Report May 2025
Rocket Homes | rocket.com
This source provided the median home sold price for Anaheim at $910,000 in May 2025, representing a 4.1% increase from the previous year. The report also included data on days on market, price per square foot, and overall market trends for Anaheim properties. This data is essential for understanding entry costs for rental property investments in Anaheim compared to neighboring cities.
📍 Source: https://www.rockethomes.com/real-estate-trends/ca/anaheim
2. Malakai Sparks Group – Why Investors Are Flocking to Anaheim Rental Properties
The Malakai Sparks Group | malakaisparks.com
This source reported that traditional rental properties in Anaheim yield an average income of $2,763 monthly, while short-term vacation rentals average $4,121. The 49% premium for short-term rentals represents a significant cash flow advantage for investors positioned near Disneyland, though it requires more active management. This data is critical for comparing rental income potential across North Orange County investment markets.
📍 Source: https://www.malakaisparks.com/why-investors-are-flocking-to-anaheim-rental-properties/
3. Redfin – Fullerton Housing Market
Redfin Corporation | redfin.com
Redfin reported Fullerton’s median sale price at $1.1 million with an average house price of $980K, showing 11.6% year-over-year appreciation. This source provided comprehensive market data including days on market (56 days), competitive scoring, and offer patterns. The pricing data positions Fullerton in the middle tier among North Orange County investment options with stronger appreciation than Anaheim during recent periods.
📍 Source: https://www.redfin.com/city/7158/CA/Fullerton/housing-market
4. Redfin – Orange Housing Market
Redfin Corporation | redfin.com
This source established Orange’s median sale price at $1.1 million with 2.9% year-over-year appreciation and 43 days on market. The data shows Orange commanding premium pricing compared to Anaheim while offering more modest appreciation than Fullerton. This positioning reflects Orange’s affluent tenant base and lower overall rental demand compared to more renter-heavy markets.
📍 Source: https://www.redfin.com/city/13969/CA/Orange/housing-market
5. Matthews Real Estate – Orange County Multifamily Market Report Q3 2025
Matthews Real Estate Investment Services | matthews.com
Matthews reported Orange County’s multifamily vacancy rate held at 4.0% in Q3 2025, the second-lowest in the nation. This exceptionally tight market reflects persistent housing demand and limited new supply, creating favorable conditions for rental property investors. The low vacancy rate supports faster tenant placement and higher occupancy rates across all three cities analyzed.
📍 Source: https://www.matthews.com/market_insights/orange-county-ca-multifamily-market-report-q3-2025
6. Matthews Real Estate – Orange County Multifamily Market Report Q3 2025
Matthews Real Estate Investment Services | matthews.com
This report documented cap rates around 4.4% for Orange County multifamily properties based on Q3 2025 sales volume of approximately $159 million with an average price per unit of $447,000. The cap rate data reflects continued investor confidence despite elevated interest rates, indicating strong fundamentals supporting property valuations across the county including Anaheim, Fullerton, and Orange.
📍 Source: https://www.matthews.com/market_insights/orange-county-ca-multifamily-market-report-q3-2025
7. Malakai Sparks Group – Why Investors Are Flocking to Anaheim Rental Properties
The Malakai Sparks Group | malakaisparks.com
This source reported that 55.4% of Anaheim’s population are renters with a low vacancy rate of 4.5%. The high renter population creates substantial tenant demand that supports consistent occupancy rates and competitive rental pricing. This demographic factor makes Anaheim particularly attractive for investors targeting rental income rather than owner-occupied buyers.
📍 Source: https://www.malakaisparks.com/why-investors-are-flocking-to-anaheim-rental-properties/
8. What’s My Cash Flow – Why Anaheim Real Estate Is a Top Investment in 2025
What’s My Cash Flow | whatsmycashflow.com
This analysis confirmed Anaheim’s vacancy rate at 4.5%, which the source characterized as very low, indicating strong rental market demand. The low vacancy rate means rental properties don’t sit empty between tenants, reducing the financial impact of turnover periods and supporting stable cash flow projections for investors.
📍 Source: https://whatsmycashflow.com/blogs/news/anaheim-investment
9. Malakai Sparks Group – Anaheim Real Estate Market Trends to Watch in 2025
The Malakai Sparks Group | malakaisparks.com
This report documented Anaheim’s 10-year appreciation rate at 7.2% with a projected 18.267% increase in sales prices over the next decade. The historical appreciation data demonstrates Anaheim’s resilience and long-term value growth potential, making it attractive for investors focused on equity building alongside rental income generation.
📍 Source: https://www.malakaisparks.com/anaheim-real-estate-market-trends-to-watch-in-2025/
10. Malakai Sparks Group – Why Investors Are Flocking to Anaheim Rental Properties
The Malakai Sparks Group | malakaisparks.com
This source reported home values surged by 12.1% over the past year with the median sale price reaching $945,000 in October 2024. This appreciation rate significantly exceeds historical averages and demonstrates strong market demand even during periods of rising interest rates. The data supports Anaheim’s position as a strong appreciation play for long-term investors.
📍 Source: https://www.malakaisparks.com/why-investors-are-flocking-to-anaheim-rental-properties/
11. What’s My Cash Flow – Why Anaheim Real Estate Is a Top Investment in 2025
What’s My Cash Flow | whatsmycashflow.com
This analysis detailed the OCVibe project as a $4 billion development around the Honda Center featuring a mix of entertainment, shopping, dining, apartments, offices, hotels, parks, and open spaces. Parking structures scheduled to open in 2025 signal the project’s momentum. This transformative development is expected to boost local real estate values significantly as the Platinum Triangle area evolves.
📍 Source: https://whatsmycashflow.com/blogs/news/anaheim-investment
12. Apartments.com – Average Rent in Fullerton
CoStar Group | apartments.com
This source reported average rent in Fullerton at $2,120 per month as of August 2025, which is 29% higher than the national average. The data provides essential rental income benchmarks for investors comparing cash flow potential across North Orange County markets. Fullerton’s rental rates position it between Anaheim’s high-end vacation rentals and Orange’s premium pricing.
📍 Source: https://www.apartments.com/rent-market-trends/fullerton-ca/
13. Point2Homes – Average Rent in Fullerton
Point2Homes | point2homes.com
This analysis documented that 48% of Fullerton residents are renters occupying 22,755 units, while homeowners live in 24,259 properties. The substantial renter population creates consistent tenant demand, particularly near Cal State Fullerton, supporting stable occupancy rates for investment properties. The demographic split indicates a balanced market with opportunities for both rental and resale strategies.
📍 Source: https://www.point2homes.com/US/Average-Rent/CA/Fullerton.html
14. Redfin – Fullerton Housing Market
Redfin Corporation | redfin.com
Redfin reported homes in Fullerton receive 2 offers on average and sell in around 56 days. This moderate competition level indicates a balanced market where investors have time to conduct due diligence without facing the frenzied bidding wars that characterized 2021-2022. The 56-day timeline is longer than Anaheim’s hottest neighborhoods but faster than many California markets.
📍 Source: