Best North OC Rental Investments: Anaheim vs Fullerton 2025
![]()
North Orange County Rental Investment: Comparing Anaheim, Fullerton, and Orange for 2025
By Wendy Rawley REALTOR® | DRE #01898824 | December 2025
⚡ Quick Answer
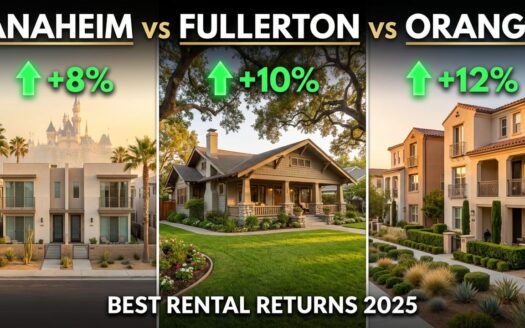
Highest rental yield: Anaheim at 3.74% gross yield with $2,650/month average rents on $918K median entry price
Best for appreciation + stability: Fullerton at 7.2% YoY appreciation with CSUF’s 40,000 students anchoring tenant demand
Best tenant quality: Orange commands $2,799/month rents with higher-income renters, though yield drops to 2.8%
📊 Methodology & Data Sources
Primary market data: Redfin city market reports, November-December 2025
Rental yield calculations: Average monthly rent × 12 ÷ median home price
Short-term rental data: AirDNA market analytics for Anaheim vacation rentals
Demographic data: U.S. Census Bureau, Niche.com city profiles
Variables affecting returns: Property condition, proximity to employment centers, school boundaries, STR regulations
We’ve been getting more calls from investors this quarter – specifically people who’ve watched their stock portfolios bounce around and are looking for something tangible. The question that keeps coming up: where in North Orange County actually makes sense for rental income right now? Not just “which city is cheapest,” but which market matches the specific investment thesis you’re running.
The answer depends entirely on whether you’re optimizing for cash flow, appreciation, or tenant stability. Anaheim offers the lowest entry price at around $918,000 median according to Redfin1 with the highest rental yield in the triad at roughly 3.74%. Fullerton sits in the middle at $1.1 million median but delivers stronger appreciation – 7.2% year-over-year – plus the built-in tenant pipeline from Cal State Fullerton’s 40,000 students.2 And Orange commands premium rents at $2,799 monthly, but with more modest 2.9% appreciation and lower overall yields around 2.8%.3
Our team has closed 17 transactions in the Anaheim Hills area since 2012, representing both buyers and sellers at price points from $437,000 to $1.295 million. That experience shapes our perspective on North Orange County rental investment opportunities – not the theoretical returns but what happens when you’re managing tenants, dealing with maintenance calls, and navigating local regulations.
North Orange County rental investment metrics that actually matter
Before diving into neighborhood-level analysis, here’s how the three markets stack up on the metrics that determine whether an investment property actually pencils out:
| Investment Factor | Anaheim | Fullerton | Orange |
|---|---|---|---|
| Median Home Price | $918,000 | $1,100,000 | $1,100,000 |
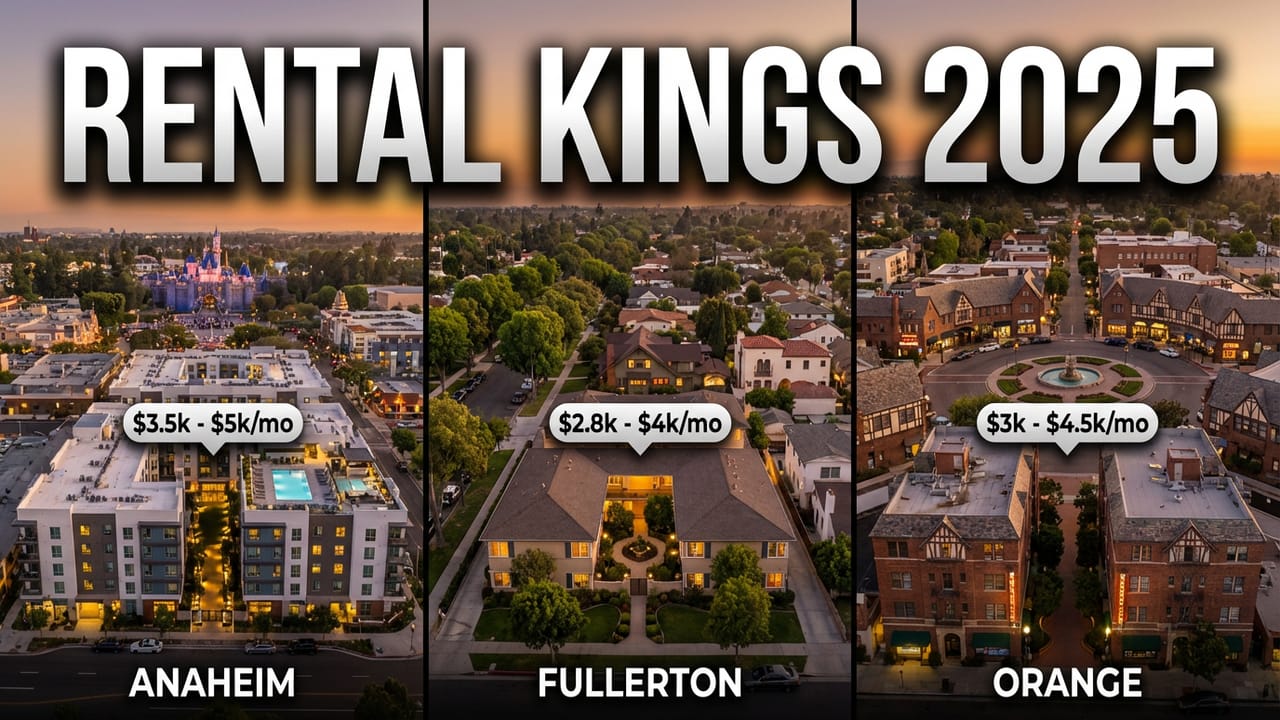
| Average Monthly Rent | $2,650 | $2,120 – $2,537 | $2,799 |
| Gross Rental Yield | 3.74% | 2.63% | 2.8% |
| YoY Appreciation | +7.4% | +7.2% | +2.9% |
| Renter Population | 55.4% | 48% | ~40% |
| Vacancy Rate | 4.5% | ~5% | ~4% |
| Days on Market | 49 days | 33 days | ~40 days |
Source: Redfin market data1, 2, 3 AirDNA4 December 2025
That 3.74% gross yield in Anaheim might not sound exciting compared to Midwest markets, but it substantially exceeds Orange County’s average of 2.85%.1 And when you factor in the 7.4% appreciation, you’re looking at total returns that compete with most equity portfolios – with a physical asset backing the investment.
Anaheim: The cash flow plays with a tourism kicker
Anaheim’s investment thesis is straightforward: the lowest entry price, the highest yield, and a tourism economy that drives rental demand patterns not found in other North OC cities. The median sits around $918,000 with homes typically selling at $574 per square foot1 – roughly $65,000 to $180,000 less than comparable properties in Fullerton or Orange.
Traditional long-term rentals average $2,650 monthly4, but the real opportunity lies in short-term vacation rentals near Disneyland. Properties positioned correctly are generating an average monthly income of $4,121 through Airbnb and similar platforms – that’s a 49% premium over long-term rental income.4 During peak summer months (particularly July), daily rates exceed $361 with monthly revenues hitting $8,243.4
The STR regulation reality check
Here’s where investor enthusiasm meets regulatory reality. Anaheim’s Chapter 4.05 of the Municipal Code currently restricts the issuance of new short-term rental registrations.5 Existing permitted operators can continue under strict regulations: three-night minimum stays, 10% Transient Occupancy Tax compliance, and good-neighbor provisions requiring 24/7 complaint response within 45 minutes.5
For new investors evaluating North Orange County rental investment options, this means choosing between two strategies: pursue long-term rentals at the $2,650 monthly average, or seek properties with existing STR permits in the secondary market (which command premium prices for precisely this reason). The regulation essentially creates a moat around permitted properties – a limited supply with sustained demand from Disneyland visitors.
Where the development money is going
Anaheim’s long-term investment case gets stronger when you look at what’s being built. The $4 billion OCVibe entertainment complex near Honda Center in the Platinum Triangle is creating thousands of hospitality, dining, and entertainment jobs.6 DisneylandForward expansion represents additional billions in committed investment.1 West Anaheim neighborhoods absorbed approximately 200 multifamily rental units in Q2 2025 alone, signaling institutional confidence in the market’s rental demand trajectory.7
The demographic foundation supports this: Anaheim’s 344,561 residents skew younger with a median age of 35.9 years and median household income of $90,583.8 More than 55% of residents are renters4 – this isn’t a market where you’re fighting cultural preferences for homeownership. Renting is the norm, and your tenant pool is deep.
Fullerton: University-anchored stability with appreciation upside
Fullerton occupies the strategic middle ground – higher entry price than Anaheim, but with risk characteristics that make it attractive for investors prioritizing wealth building over immediate cash flow. The median home price of $1.1 million represents a meaningful premium. Yet, Fullerton’s 7.2% year-over-year appreciation and, notably, 11.6% appreciation over the preceding year suggest the market hasn’t finished its growth cycle.2
The anchor tenant for Fullerton’s rental market is Cal State Fullerton, with approximately 40,000 enrolled students, creating consistent demand that persists through economic cycles and seasonal tourism fluctuations.2 This creates two distinct sub-markets: student housing concentrated near campus (favoring studios and one-bedrooms with higher turnover but predictable lease cycles tied to academic calendars) and professional rentals attracting faculty, staff, and workers throughout Orange County who value Fullerton’s central location.
The tenant quality advantage
Fullerton’s median household income of $104,219 significantly exceeds Anaheim’s $90,583.9 For landlords, this translates to reduced credit risk, more substantial lease enforcement leverage, and tenants who are less likely to experience income disruptions that lead to late payments or defaults. The rent range of $2,120 to $2,537 monthly2 delivers lower gross yields (around 2.63% on the median), but the reliability premium matters when you’re comparing real-world returns rather than spreadsheet projections.
Market velocity tells the story here: Fullerton homes sell within an average of 33 days – faster than both Anaheim (49 days) and Orange.2 Properties rated “very competitive” often receive multiple offers, including waived contingencies. If you need to exit an investment, Fullerton provides liquidity that some other markets don’t.
The appreciation-vs-cash-flow trade-off
Fullerton’s investment thesis requires accepting a different return profile. You’re carrying properties with modest or even break-even cash flow initially, betting on annual appreciation, equity buildup through mortgage paydown, and rental rate growth over a 5-10-year holding period. This works well for investors with high W-2 income who benefit from depreciation deductions and don’t need immediate cash flow. It’s less suitable for investors counting on rental income to cover carrying costs from day one.
For a deeper look at what drives buyer behavior in this market, our guide on what North Orange County buyers actually search for covers the specific features and neighborhoods generating the most interest.
Orange: Premium positioning with tenant quality at the top
Orange commands the highest rents in the triad at $2,799 monthly3, but with median home values also around $1.1 million and more modest appreciation at 2.9% year-over-year, the math works differently. Gross rental yield comes in around 2.8% – higher than Fullerton but below Anaheim and below the county average.
What you’re buying in Orange is tenant quality. This is an affluent market with established neighborhoods, a high homeownership rate (around 60%), and renters who are professionals, executives, or families who can afford to buy but choose to rent for flexibility. These tenants maintain properties well, pay on time, and renew leases at higher rates. The operational headaches that plague some rental portfolios – evictions, property damage, collection issues – occur less frequently here.
When Orange makes sense
Orange investment properties suit investors with sufficient capital to accept lower yields in exchange for stability, seeking exposure to Orange County real estate without the volatility of tourism-dependent markets, or building portfolios that prioritize quality over maximizing unit count. A four-property portfolio in Orange might generate less monthly income than six properties in Anaheim, but with substantially less management intensity and tenant turnover.
The city’s Old Towne district and established neighborhoods near Chapman University create micro-markets where rental demand remains stable regardless of broader economic conditions. Properties within walking distance of Old Towne’s restaurant and retail scene command premiums because tenants value the walkability and community character – factors that don’t show up in yield calculations but absolutely affect occupancy and renewal rates.
⚠️ Watch the appreciation spread: Orange’s 2.9% appreciation trails both Anaheim (7.4%) and Fullerton (7.2%) significantly. Over a 10-year hold, this gap compounds to meaningful differences in total returns. If you’re optimizing for wealth building through equity growth, the lower-priced markets may actually deliver superior outcomes.
Matching your North Orange County rental investment strategy to the right market
The “best” investment market depends entirely on what you’re trying to accomplish. Here’s how to think about the decision:
| Your Investment Priority | Best Market | Why |
|---|---|---|
| Maximize cash flow | Anaheim | Lowest entry price + highest yield (3.74%) |
| Tourism/STR income | Anaheim | Disneyland proximity, $4,121/month STR potential |
| Long-term appreciation | Fullerton | 7.2% YoY + 11.6% trailing appreciation |
| Student housing | Fullerton | 40,000 CSUF students = consistent demand |
| Tenant quality/stability | Orange | Higher incomes, professional renters, less turnover |
| Exit liquidity | Fullerton | 33 days average sale time (fastest) |
| Lowest management intensity | Orange | Higher renewal rates, fewer tenant issues |
*Based on current market conditions as of December 2025
What the current market timing tells us
December 2025 data reveals a transitional period worth understanding. Anaheim’s pending sales declined 53.8% year over year, while active inventory increased 14.7% to 218 units.10 Homes now require a median 27 days on market (up from 22), and properties are achieving 99.7% of list price rather than the premiums seen in hotter months.
For investors, this represents an opportunity. The fundamental vacancy rate of 4.5% and strong 7.4% appreciation indicate that these market dynamics are temporary seasonal adjustments rather than structural deterioration.1 Sellers who were holding out for top dollar are becoming more flexible, and the expanded selection means you can be more selective about location, condition, and rental potential.
Fullerton remains competitive despite the broader softening – properties still receive multiple offers, and the 33-day average sale time hasn’t meaningfully extended. If you’re interested in that market, don’t expect the same negotiating room you might find in Anaheim.
Due diligence checklist for North OC investment properties
Regardless of which market you choose for your North Orange County rental investment, these are the factors that separate successful rental investments from underperforming ones:
School boundaries matter even for rentals. Family tenants prioritize school quality; properties within Anaheim Unified versus PYLUSD boundaries will attract different tenant profiles. Canyon High School in Anaheim Hills has above-average ratings that command rent premiums.11
HOA restrictions on rentals. Some communities limit rental percentages or require owner-occupancy periods before leasing. Always verify HOA rules before closing – discovering after purchase that you can’t rent for two years will destroy your return calculations.
Mello-Roos and special assessments. These reduce your net operating income without providing tenant-facing value. A property with $400/month in Mello-Roos effectively charges you $4,800 annually, which doesn’t translate to higher rent.
Proximity to employment centers. Anaheim’s Platinum Triangle, Fullerton’s downtown, and Orange’s proximity to Irvine all affect commute-sensitive tenant demand. The 15-minute commute test matters more than abstract “location” quality.
For families evaluating these neighborhoods as buyers rather than investors, our guide to first-time buyer neighborhoods in Anaheim, Brea, and Placentia provides additional insight into what each community offers.
Frequently asked questions about North OC rental investments
Can I actually achieve positive cash flow in Orange County?
Yes, but it requires realistic expectations and the proper property selection. Anaheim’s 3.74% gross yield can translate to modest positive cash flow with 25% down and current interest rates. Fullerton and Orange typically require larger down payments (30-40%) to achieve break-even or positive cash flow, with returns coming primarily through appreciation and equity buildup rather than monthly income.
Is the Disneyland short-term rental opportunity still viable?
For existing permitted operators, yes – properties near Disneyland generate $4,121 average monthly income with July peaks hitting $8,243.4 For new investors, Anaheim’s current STR registration restrictions channel you toward long-term rentals or acquiring properties with existing permits, which trade at premium prices.
Which market has the lowest vacancy risk?
Fullerton’s university-anchored demand creates the most predictable occupancy patterns – CSUF’s 40,000 students ensure consistent tenant demand regardless of economic conditions. Anaheim’s 4.5% vacancy rate is also strong, though more sensitive to tourism fluctuations. Orange offers stability through tenant quality rather than demand volume.
How do property taxes affect rental returns?
California’s Proposition 13 limits annual property tax increases to 2%, benefiting long-term investors. However, purchase triggers reassessment to current market value – a property last sold in 2010 might be paying $4,000 annually while your purchase would reset taxes to $12,000-15,000 based on the $918K-$1.1M price range. Factor this into yield calculations.
What’s the typical tenant turnover in each market?
Student housing near CSUF in Fullerton sees annual turnover aligned with academic years. Family tenants in Orange typically have 3-5-year tenancies. Anaheim varies by neighborhood – tourist-area STRs obviously turn over constantly, while family neighborhoods in Anaheim Hills see 2-4 year average tenancies.
Should I use a property manager or self-manage?
For out-of-area investors or those building portfolios beyond 2-3 units, professional management (typically 8-10% of rent) makes sense. Self-management is more effective for local investors with single properties, especially in Orange, where tenant quality reduces management intensity. Anaheim STRs essentially require professional management or a dedicated time commitment.
Is now a good time to buy investment property in North Orange County?
The December 2025 market shift – expanded inventory, longer days on market, sellers achieving 99.7% rather than 100%+ of list – creates better buying conditions than we’ve seen in two years. The fundamentals (low vacancy, strong appreciation trends, population growth) remain unchanged, making this a potentially favorable entry point.
🎯 Key Takeaways
- Highest immediate yield: Anaheim at 3.74% gross yield, $918K median entry
- Best appreciation trajectory: Fullerton at 7.2% YoY (11.6% trailing)
- Strongest tenant quality: Orange with $104K+ household incomes, lowest turnover
- Current opportunity window: December 2025 market softening creates negotiating room
- STR caveat: Anaheim restricts new permits – existing permits trade at a premium
📖 Key Terms
- Gross Rental Yield
- Annual rent divided by property price; doesn’t account for expenses, vacancies, or taxes.
- Cap Rate
- Net operating income divided by property price; accounts for operating expenses but not financing.
- Days on Market (DOM)
- Average time from listing to accepted offer; indicates demand strength and liquidity.
- Transient Occupancy Tax (TOT)
- Local tax on short-term rentals, typically 10-12%; paid by guests but collected by hosts.
- Mello-Roos
- Special tax district assessment funding infrastructure in newer developments; adds to annual carrying costs.
- Prop 13 Base Year Value
- The property’s assessed value is locked at the purchase price, increasing by no more than 2% annually until the next sale.

About Wendy Rawley
Wendy Rawley has helped investors and homebuyers navigate North Orange County real estate for over a decade. With experience across Anaheim, Fullerton, Brea, and Yorba Linda – and transactions ranging from starter homes to $1.3M properties – she understands the rental dynamics, tenant markets, and neighborhood nuances that determine whether an investment actually pencils out.
Ready to Analyze Investment Properties in North Orange County?
We’ll run the numbers on specific properties – rental comps, expense projections, realistic yield calculations – so you can make investment decisions based on data, not assumptions.
📚 Sources & References
1. Redfin – Anaheim Housing Market
Redfin | redfin.com | Accessed December 2025
Primary source for Anaheim median home prices ($918,000-$956,000), price per square foot ($574), year-over-year appreciation (7.4%), and days on market data. Also provided competitive market indicators and pending sales trends.
📍 Source: https://www.redfin.com/city/308/CA/Anaheim/housing-market
2. Redfin – Fullerton Housing Market
Redfin | redfin.com | Accessed December 2025
Source for Fullerton median home prices ($980,000-$1.1M), price per square foot ($648), year-over-year appreciation (7.2%), and 33-day average sale time. Also cited for competitive market conditions and Cal State Fullerton enrollment impact on rental demand.
📍 Source: https://www.redfin.com/city/6373/CA/Fullerton/housing-market
3. Redfin – Orange Housing Market
Redfin | redfin.com | Accessed December 2025
Primary source for Orange median home values ($1.1M), average monthly rent ($2,799), year-over-year appreciation (2.9%), and rental yield calculations (2.8%).
📍 Source: https://www.redfin.com/city/13962/CA/Orange/housing-market
4. AirDNA – Anaheim Short-Term Rental Market
AirDNA | airdna.co | Accessed December 2025
Source for Anaheim short-term vacation rental income data ($4,121 monthly average, $8,243 peak July revenue, $361 daily rates), occupancy rates (51% annual average), and traditional vs. STR income comparisons. Also provided vacancy rate data (4.5%) and renter population percentage (55.4%).
📍 Source: https://www.airdna.co/vacation-rental-data/app/us/california/anaheim/overview
5. City of Anaheim – Municipal Code Chapter 4.05
City of Anaheim | anaheim.net | Accessed December 2025
Source for Anaheim short-term rental regulations including registration restrictions, three-night minimum stay requirements, 10% Transient Occupancy Tax compliance, and good-neighbor provisions requiring 24/7 complaint response within 45 minutes.
📍 Source: https://www.anaheim.net/1469/Short-Term-Rentals
6. OCVibe Development
Honda Center / City of Anaheim | ocvibe.com | Accessed December 2025
Source for $4 billion OCVibe entertainment complex development near Honda Center in Platinum Triangle, including projected employment creation across hospitality, dining, entertainment, and professional services sectors.
📍 Source: https://www.ocvibe.com/
7. CoStar Group – Orange County Multifamily Report
CoStar Group | costargroup.com | Accessed Q2 2025
Source for West Anaheim multifamily absorption data (approximately 200 units in Q2 2025) and institutional investment trends in Anaheim rental market.
📍 Source: https://www.costargroup.com/costar-news
8. Niche.com – Anaheim Demographics
Niche | niche.com | Accessed December 2025
Source for Anaheim population (344,561), median age (35.9 years), median household income ($90,583), and demographic composition data used to characterize tenant demand patterns.
📍 Source: https://www.niche.com/places-to-live/anaheim-orange-ca/
9. Niche.com – Fullerton Demographics
Niche | niche.com | Accessed December 2025
Source for Fullerton median household income ($104,219) and renter population percentage (48%) used to compare tenant quality metrics across the three markets.
📍 Source: https://www.niche.com/places-to-live/fullerton-orange-ca/
10. Anaheim Market Trends – Pending Sales Data
Redfin | redfin.com | Accessed December 2025
Source for December 2025 market shift indicators including 53.8% pending sales decline, 14.7% inventory increase (218 units), extended days on market (27 median, 35 average), and list-to-sale price ratios (99.7%).
📍 Source: https://www.redfin.com/city/308/CA/Anaheim/housing-market
11. GreatSchools – Canyon High School
GreatSchools | greatschools.org | Accessed December 2025
Source for Canyon High School ratings and Anaheim Unified School District performance data used to illustrate school boundary impacts on rental demand and tenant profiles.
📍 Source: https://www.greatschools.org/california/anaheim/schools/
⚖️ Important Disclaimer
The information provided in this article is for informational purposes only and should not be construed as legal, tax, financial, or investment advice. Real estate markets are dynamic, and data cited may change after publication. Always consult with qualified professionals—including licensed attorneys, CPAs, and financial advisors—before making any real estate investment decisions. Wendy Rawley is a licensed California REALTOR® | DRE #01898824 | First Team Real Estate.