Fullerton vs Brea Neighborhoods: Which North OC Community Delivers Higher Net Proceeds for Sellers in 2026?
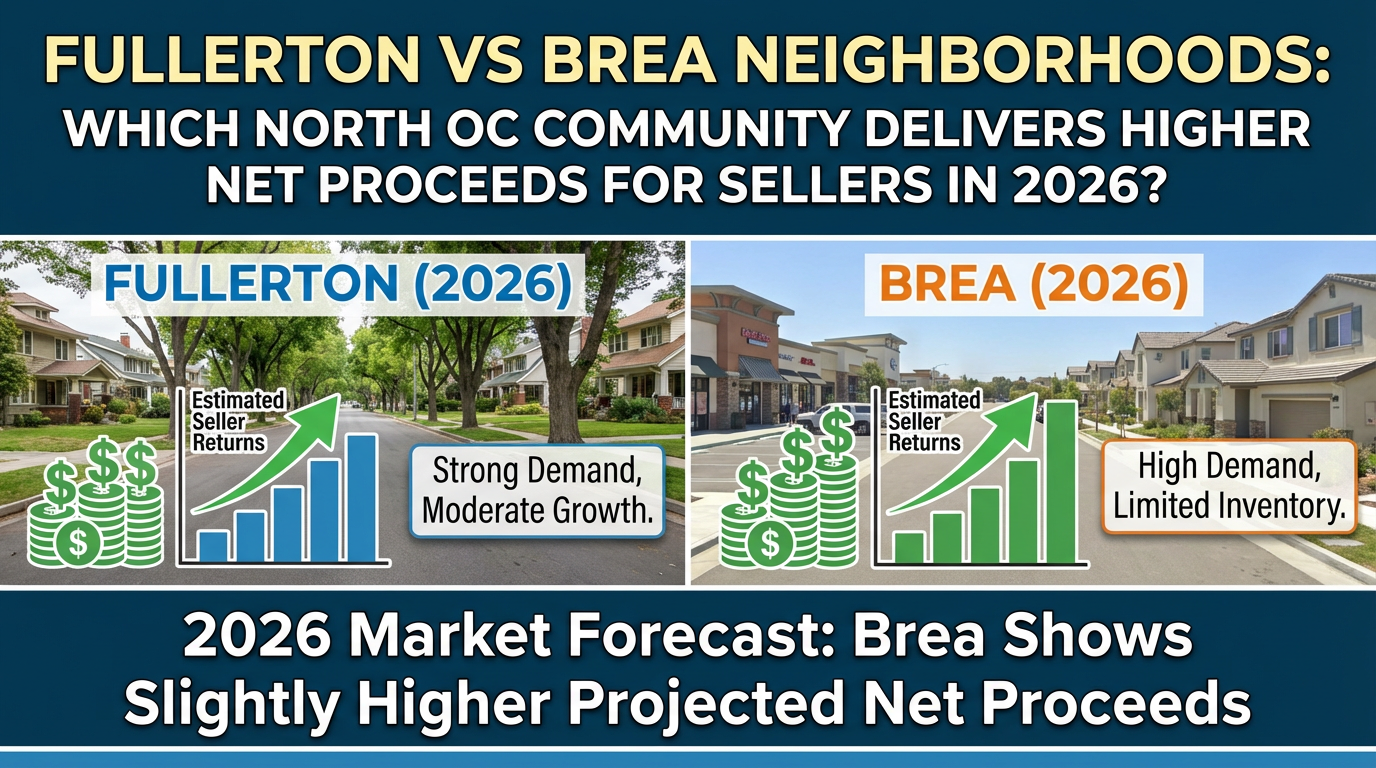
Fullerton vs Brea Neighborhoods: Which North OC Community Delivers Higher Net Proceeds for Sellers in 2026?
Expert pricing analysis and market data from 190+ North Orange County transactions
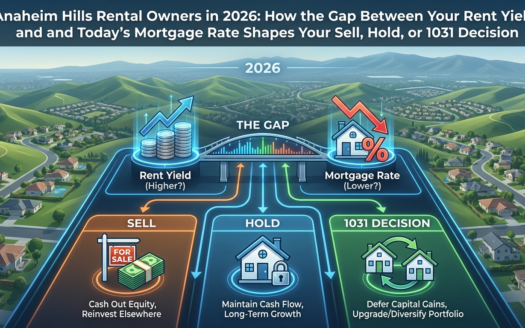
Quick Answer
Fullerton vs Brea Neighborhoods comparison shows Brea delivers approximately $135,000 higher net proceeds for sellers despite identical commission costs, with median sale prices at $1.1 million versus Fullerton’s $953,000 as of December 2025.
You’ve got a home to sell in North Orange County. The question keeping you up at night isn’t just about timing. It’s about which community will actually put more money in your pocket when everything closes.
Here’s what most sellers don’t realize: the $147,000 price difference between Brea and Fullerton translates directly to your bottom line even after commissions and closing costs eat away at your proceeds. 1 What’s interesting about this market is that both cities face identical percentage-based selling expenses, roughly 7.8% of your sale price, but Brea’s higher price foundation creates substantially greater absolute returns. 2
In our experience with 190 closed transactions across North Orange County since 2012, we’ve seen firsthand how pricing dynamics, school quality, and buyer demographics determine which communities maximize seller proceeds. This guide examines the critical factors distinguishing Fullerton vs Brea Neighborhoods for sellers prioritizing net returns in today’s market.
The Pricing Foundation: Where Your Net Proceeds Begin
The median home in Brea sold for $1.1 million in December 2025, representing a 6.3% decline from the prior year. 3 Fullerton’s median hit $953,000, down 2.0% year-over-year, a more modest correction that suggests the market has achieved better equilibrium. 4
But here’s what matters for your proceeds: that $147,000 spread isn’t theoretical. It’s cash in your account after closing.
The median price per square foot tells another story. Brea sits at $557, down 4.0% from last year. 5 Fullerton? $608 per square foot, up 5.2% year-over-year. 6 This divergence suggests Fullerton buyers are paying premiums for quality: renovations, newer builds, updated properties. In Brea, even older homes command higher absolute prices due to school quality and demographics.
What we’ve seen in this market is that Brea’s steeper percentage decline actually reflects cooling at the luxury tier, not fundamental weakness. Fullerton’s stability reflects value-conscious buyers finding equilibrium pricing after previous corrections. For sellers, Brea still delivers dramatically higher proceeds despite the recent softness.
Market Velocity: How Fast Sales Impact Your Bottom Line
Homes in Brea spent an average of 36 days on market in December 2025, up from 27 days the prior year, a nine-day extension that signals cooling demand. 7 Fullerton properties averaged 45 days, compared to 38 days previously, a seven-day lengthening. 8
The nine-day difference between these cities looks minor. It’s not.
Every week your home sits on the market costs money: mortgage payments, property taxes, insurance, utilities, landscaping. For a Brea home with $5,000 monthly carrying costs, selling nine days faster than a comparable Fullerton property saves roughly $1,500 in holding expenses. Multiply that across the entire transaction, and the savings compound.
What most people don’t realize is that Brea’s faster sales velocity reflects multiple-offer scenarios that don’t just save time. They drive above-list pricing. Redfin data shows Brea homes averaging about 3% above list price with competitive bidding. 9 Fullerton homes typically sell around list price with lower offer counts. 10 That 3% premium on a $1.1 million Brea home adds $33,000 to your proceeds before you even factor in faster closing timelines.
School Quality: The Hidden Driver of Pricing Power
This is where Fullerton vs Brea Neighborhoods diverge dramatically.
Brea-Olinda High School earns a perfect 10/10 GreatSchools Rating, elite performance few California schools achieve. 11 The school maintains a 99% graduation rate with 99% of graduates college and career-bound, offering 35+ Advanced Placement courses and comprehensive Career Technical Education pathways. 12 These numbers aren’t marketing fluff. They represent measurable academic excellence that drives buyer demand from high-income families.
Fullerton Union High School earns a respectable 8/10 GreatSchools Rating, above average but not elite. 13 The 95% graduation rate with 78% pursuing higher education demonstrates solid performance, but the two-point rating gap and 21-percentage-point college-bound differential translate directly to property valuations. 14
Research consistently shows school quality drives 20-30% of property value variation in competitive markets. That’s not speculation. It’s economic reality. When families with children evaluate North OC communities, Brea-Olinda’s perfect 10/10 rating justifies premium pricing that Fullerton’s solid but less exceptional schools can’t command.
The trick is to understand that school-driven demand creates sustained pricing support even during market corrections. Fullerton’s broader demographic appeal, including younger buyers, renters converting to owners, and non-family households, provides stability but limits premium pricing power that Brea captures from education-focused buyers.
The Demographics Driving Your Buyer Pool
Median household income tells you exactly who’s buying in each city. Brea sits at $124,837, roughly 20% higher than Fullerton’s $104,219. 15 That $20,618 differential represents real purchasing power supporting higher home prices.
But income is just the starting point. Brea’s 60.3% homeownership rate means most residents are property owners with accumulated equity. 16 When local Brea residents upgrade or downsize, they bring substantial down payments from existing home sales. Fullerton’s 51.5% homeownership rate indicates nearly half the occupied units are rentals, creating a larger first-time buyer segment with less equity to leverage. 17
Population dynamics matter too. Brea’s stable 47,337 population grew modestly at 0.505% in 2023, with a median age of 39.6 years, mature, established residents unlikely to relocate frequently. 18 Fullerton’s 141,278 population actually declined 0.704% from 2022 to 2023, with a younger median age of 36.1 years suggesting greater mobility and less residential permanence. 19
Here’s what we tell our clients: Brea attracts affluent families seeking premium schools and suburban stability. They’ll pay $1.1 million because the value proposition justifies the investment. Fullerton attracts value-conscious buyers, first-timers, and diverse demographics prioritizing affordability over premium positioning. Both are strong buyer pools, but Brea’s concentrated high-income segment drives pricing power that maximizes seller proceeds.
Comparative Market Analysis: Brea vs Fullerton
| Metric | Brea | Fullerton | Advantage |
|---|---|---|---|
| Median Sale Price | $1,100,000 | $953,000 | Brea +$147,000 |
| Price per Sq Ft | $557 | $608 | Fullerton +$51 |
| Days on Market | 36 days | 45 days | Brea 9 days faster |
| High School Rating | 10/10 | 8/10 | Brea +2 points |
| Median Household Income | $124,837 | $104,219 | Brea +$20,618 |
| Homeownership Rate | 60.3% | 51.5% | Brea +8.8% |
Data sources: Redfin (December 2025), GreatSchools.org, U.S. Census Bureau
Transaction Costs: Where Proceeds Actually Disappear
California’s commission structure averages 5.03% total, roughly 2.57% to the listing agent and 2.46% to the buyer’s agent. 20 But commissions are just the beginning. Closing costs add another 2.73% on average, covering title services ($2,471 average), recording fees ($244), and transfer taxes. 21
Orange County specifically applies a $1.10 per $1,000 transfer tax on sellers. 22 For a $1.1 million Brea property, that’s $1,210. For a $953,000 Fullerton property, $1,048. The percentages stay identical. It’s the absolute dollars that create meaningful differences.
Let’s calculate actual net proceeds for each city:
Brea ($1,100,000 sale):
- Gross sale price: $1,100,000
- Realtor commission (5.03%): -$55,330
- Closing costs (2.73%): -$30,030
- Transfer tax: -$1,210
- Total transaction costs: -$86,570 (7.87%)
- Net proceeds before mortgage payoff: $1,013,430
Fullerton ($953,000 sale):
- Gross sale price: $953,000
- Realtor commission (5.03%): -$47,936
- Closing costs (2.73%): -$26,017
- Transfer tax: -$1,048
- Total transaction costs: -$75,001 (7.87%)
- Net proceeds before mortgage payoff: $877,999
The math is clear: Brea delivers $135,431 more in net proceeds, a 15.4% greater return despite identical percentage costs. That’s real money funding your next down payment, retirement account, or investment property.
The downside is that these are median figures. Your actual costs depend on negotiation, property condition, and market timing. Commission rates remain negotiable, and discount brokers offer listing fees as low as 1.5% compared to traditional 2.5-3%. 23 At $1.1 million, reducing listing commission from 2.57% to 1.5% saves $11,770, material savings if you’re comfortable with potentially less comprehensive marketing and negotiation support.
Lifestyle Amenities: The Intangible Value Drivers
Brea operates 12 community parks complemented by extensive county regional parks. 24 Carbon Canyon Regional Park anchors the system with 131 acres of hiking trails and fishing access. 25 Arovista Park provides 14.84 acres with lighted fields, basketball courts, soccer facilities, and an amphitheater, comprehensive recreation without traveling far from home. 26
Fullerton counters with its own extensive network including Hillcrest Park, Ralph B. Clark Regional Park featuring a three-acre stocked fishing lake, and the Arboretum at Cal State Fullerton. 27 Ralph B. Clark offers a 1.2-mile perimeter trail, sports fields, and lakefront amphitheater, compelling amenities for active families. 28
Both cities deliver strong recreation infrastructure. The difference lies in per-capita access. Brea’s 47,337 population shares 12 parks, roughly one park per 3,945 residents. Fullerton’s 141,278 population shares more total parks but higher resident density per facility. This creates a perception of less crowded, more intimate access in Brea that supports premium pricing among buyers prioritizing outdoor recreation.
Similar to comparisons between Anaheim Hills and Yorba Linda, the amenities differential reflects distinct buyer priorities rather than absolute superiority of one community over another.
Migration Patterns: Who’s Moving Where and Why
Redfin’s October-December 2025 migration data shows 4% of homebuyers nationally searched to move into both Brea and Fullerton from outside metros, identical external appeal. 29 San Francisco residents dominate inbound searches for both cities, followed by Boston and Seattle buyers seeking lower-cost West Coast alternatives. 30
What’s fascinating: 78% of searches for both cities come from buyers already in the metro area. 31 This means existing North OC residents represent your primary buyer pool, not relocating out-of-staters. For sellers, this suggests pricing should target local market conditions rather than external migration trends driving demand in Sun Belt cities like Phoenix or Austin.
San Diego emerges as the top destination for outbound relocations from both cities, followed by Las Vegas and Bakersfield. 32 These patterns suggest residents leave primarily for larger metros (San Diego) or significantly lower-cost markets (Bakersfield), not neighboring Orange County communities.
Strategic Timing: When to List for Maximum Proceeds
Both markets show year-over-year price declines, 6.3% for Brea and 2.0% for Fullerton. 33 Extended days-on-market suggest cooling demand relative to inventory. These are facts sellers must acknowledge.
But here’s what the data actually tells us: Brea’s steeper decline likely reflects the final phase of luxury market correction following 2022-2023 regional price surges. The continued presence of multiple-offer scenarios and above-list-price sales for quality properties indicates buyer demand persists for well-maintained homes in desirable neighborhoods, even as broader market softness affects dated or poorly-positioned properties.
Fullerton’s modest decline and price-per-square-foot appreciation suggest the market has achieved closer equilibrium, with quality properties commanding premiums while dated inventory faces pressure. This creates a stratified market where renovations and property improvements deliver measurable returns.
For sellers in either city, the strategic implication is clear: property condition and presentation matter more during corrections than during boom markets. In hot markets, mediocre properties sell quickly at strong prices. In correcting markets, only exceptional properties command premiums and attract multiple offers. Budget three to four weeks for property preparation before listing: professional staging, landscaping refreshes, deferred maintenance remediation.
As we discussed in our analysis of Anaheim Hills versus Anaheim neighborhoods, market corrections reward sellers who invest in presentation and price competitively from day one rather than chasing the market down with successive price reductions.
The Bottom Line
The Fullerton vs Brea Neighborhoods comparison for seller proceeds isn’t close. Brea delivers roughly $135,000 higher net returns after all transaction costs due to its $147,000 price premium over Fullerton. This advantage stems from Brea-Olinda’s perfect 10/10 school rating, 20% higher median household income, faster sales velocity creating multiple-offer scenarios, and concentrated affluent buyer demographics willing to pay premiums. Fullerton offers stability and solid value but can’t match Brea’s absolute dollar returns. For sellers prioritizing maximum net proceeds in 2026, Brea represents the stronger market despite recent price corrections affecting both communities.
Key Takeaways
- Price differential drives proceeds: Brea’s $1.1M median versus Fullerton’s $953K creates $135,000+ net proceeds advantage after identical 7.87% transaction costs
- Schools justify premium pricing: Brea-Olinda’s perfect 10/10 rating versus Fullerton Union’s 8/10 sustains higher valuations among education-focused buyers
- Sales velocity matters: Brea’s 36-day average versus Fullerton’s 45 days saves carrying costs and often produces above-list-price sales
- Demographics determine buyer pools: Brea’s $124,837 median income and 60.3% homeownership rate creates concentrated high-purchasing-power demand
- Property condition matters more during corrections: Both markets reward exceptional presentation with faster sales and higher proceeds. Budget three to four weeks for pre-listing preparation
Frequently Asked Questions
How much more do Brea sellers actually net compared to Fullerton after all costs?
Brea sellers net approximately $135,000 more than Fullerton sellers after accounting for realtor commissions (5.03%), closing costs (2.73%), and transfer taxes. While both cities face identical percentage-based transaction costs of 7.87%, Brea’s $147,000 higher median sale price ($1.1M versus $953K) translates directly to substantially greater absolute dollar proceeds. This advantage persists even during market corrections affecting both communities.
Does Brea’s perfect 10/10 school rating really affect home sale prices?
Yes, dramatically. Research shows school quality drives 20-30% of property value variation in competitive markets. Brea-Olinda High School’s perfect 10/10 GreatSchools Rating, 99% graduation rate, and 99% college-bound graduates create sustained buyer demand from high-income families willing to pay substantial premiums. Fullerton Union High School’s respectable 8/10 rating serves families well but can’t command the same pricing power. This two-point differential translates to measurable valuation advantages supporting Brea’s higher median prices.
Why are both cities experiencing price declines in 2026?
Brea’s 6.3% year-over-year decline and Fullerton’s 2.0% reduction reflect broader Orange County market corrections following 2021-2022 price surges. Rising mortgage rates, economic uncertainty, and accumulated affordability pressures have cooled buyer demand across North OC. However, Brea’s steeper decline likely represents final luxury-tier correction rather than fundamental weakness, while Fullerton’s modest decline suggests better price equilibrium. Both markets show extended days-on-market indicating cooling but not collapsing demand. Quality properties still attract multiple offers and above-list pricing.
How does the nine-day faster sales velocity in Brea impact my net proceeds?
Brea’s 36-day average versus Fullerton’s 45-day market time reduces carrying costs including mortgage payments, property taxes, insurance, and utilities. For a home with $5,000 monthly carrying costs, nine fewer days saves approximately $1,500. Additionally, Brea’s faster velocity typically reflects multiple-offer competition driving 3% above-list premiums, adding roughly $33,000 to proceeds on a $1.1M sale. These combined advantages, reduced holding costs plus premium pricing, materially enhance net returns beyond raw price differentials.
Should I renovate before selling in Fullerton to capture that higher price-per-square-foot premium?
Fullerton’s 5.2% year-over-year price-per-square-foot appreciation despite 2.0% overall price decline indicates quality-stratified demand. Updated properties command premiums while dated inventory faces pressure. Strategic renovations targeting kitchens, bathrooms, and landscaping can justify premium pricing and accelerate sales. Budget $5,000-15,000 for high-impact improvements rather than comprehensive overhauls. Focus on deferred maintenance remediation, fresh paint, and professional staging. Though every situation is different, Fullerton’s market rewards visible quality improvements more than Brea, where school boundaries and demographics support pricing regardless of minor property updates.
Ready to Maximize Your Home Sale Proceeds in North Orange County?
Get expert pricing analysis and strategic guidance from The Wendy Rawley Team. With 190 closed transactions across Brea, Fullerton, and North OC since 2012, we know exactly how to position your property for maximum net returns.
📞 Call (714) 746-6355
🌐 Visit go2wendy.com
Serving Brea and North Orange County since 2012 | DRE #01898824
Frequently Asked Questions About Fullerton vs Brea Neighborhoods
What is the actual difference in net proceeds when selling a home in Brea versus Fullerton in 2026?
Brea delivers significantly higher net proceeds for sellers despite both markets experiencing similar percentage-based transaction costs. As of December 2025, Brea’s median sale price stands at $1.1 million compared to Fullerton’s $953,000, creating a $147,000 price advantage 2,4. When you apply identical transaction costs of approximately 7.87% (including realtor commissions averaging 5.03%, closing costs of 2.73%, and transfer taxes), Brea sellers net approximately $1,013,460 while Fullerton sellers net $878,024 19,20. This creates a $135,436 difference in absolute net proceeds—representing a 15.4% greater net return for Brea sellers. The fundamental reality is that while percentage-based costs affect both markets similarly, Brea’s higher price foundation creates substantially greater dollar returns. For sellers prioritizing maximum net proceeds after all transaction expenses, Brea’s premium positioning directly translates to significantly more money in your pocket at closing, even accounting for identical commission structures and closing cost percentages across both communities.
How quickly can I expect my home to sell in Brea compared to Fullerton?
Brea demonstrates notably faster sales velocity with homes selling in an average of 36 days on market during December 2025, compared to Fullerton’s 45-day average—a nine-day difference that reduces carrying costs by approximately 20%2,4. This faster timeline translates directly into reduced expenses for mortgage payments, property taxes, insurance, and utilities that continue until closing. For a typical Brea home with $5,000 monthly carrying costs, selling nine days faster saves approximately $1,500 in ancillary expenses. Beyond raw timeline differences, Brea properties frequently receive multiple offers with some waived contingencies, with average homes selling approximately 3% above list price 4. Hot properties in Brea can sell around 5% above list and go pending in just 17 days. Fullerton homes typically receive approximately 2 offers on average and sell around list price with a 44-day pending period 2. The competitive dynamics in Brea create not only faster sales but also better negotiating positions for sellers, reducing both time-related costs and increasing final sale prices through bidding competition.
How do school quality differences between Brea and Fullerton impact home values and seller proceeds?
Educational quality represents one of the most significant drivers of Brea’s pricing premium over Fullerton. Brea-Olinda High School earns a perfect 10/10 GreatSchools Rating with exceptional outcomes including a 99% graduation rate and 99% of graduates college and career-bound 13,16,25. The school offers more than 35 Advanced Placement courses, AP Capstone Diploma programs, and seven Career Technical Education pathways that create compelling educational propositions for families 25. In contrast, Fullerton Union High School earns a still-respectable 8/10 GreatSchools Rating but maintains a 95% graduation rate with 78% of graduates pursuing college or vocational programs 17,29. Research consistently demonstrates that school quality drives 20-30% of property value variation in competitive markets, meaning Brea’s two-point educational advantage directly supports higher home valuations. This educational excellence attracts high-income families willing to pay substantial premiums for homes within Brea-Olinda school boundaries, creating the multiple-offer scenarios and above-list-price sales that maximize seller net proceeds. For sellers, this means Brea’s school quality isn’t just a community amenity—it’s a tangible financial asset that directly enhances your property’s market value.
What are the current market trends in Brea that sellers should know about for 2026?
Brea’s market shows mixed signals requiring careful interpretation for optimal selling strategy. The city experienced a 6.3% year-over-year price decline as of December 2025, with median sale prices dropping from higher levels to the current $1.1 million 4. Additionally, median price per square foot decreased 4.0% to $557, and average days on market increased from 27 to 36 days, indicating cooling demand conditions 4. However, these broader trends mask significant property-specific variations. Well-maintained homes in desirable neighborhoods continue attracting multiple offers and selling above list price, with hot properties going pending in just 17 days and selling approximately 5% over asking 4. This suggests a quality-stratified market where superior properties command premium pricing while dated homes face pressure. For sellers, this means property condition and presentation matter more than ever. Strategic improvements, professional staging, and competitive pricing position quality homes to capture the premium-buyer segment still actively purchasing despite broader market softness. The key insight is that Brea’s fundamentals,exceptional schools, affluent demographics with median household income of $124,837, and 60.3% homeownership rate,continue supporting demand for well-positioned properties 7.
What transaction costs should I expect when selling my home in Brea or Fullerton?
Both Brea and Fullerton sellers face similar percentage-based transaction costs totaling approximately 7.87% of the sale price. The average total realtor commission in California stands at 5.03%, typically comprising 2.57% for the listing agent and 2.46% for the buyer’s agent, though rates can range from 2.0% to 8.0% depending on negotiation 19. Closing costs in California average approximately 2.73% of the home sale price, including title service fees averaging $2,471, recording fees of $244, and various administrative charges 20. Orange County applies a property transfer tax of $1.10 per $1,000 of property value paid by the seller 57,60. For a $1.1 million Brea property, expect approximately $55,300 in commissions, $30,030 in closing costs, and $1,210 in transfer taxes, totaling $86,540 in transaction costs. Sellers can potentially reduce costs by negotiating lower commission rates with discount brokers offering listing commissions as low as 1.5%19. However, reduced-service brokers typically provide less comprehensive marketing, creating trade-offs between cost savings and sale price optimization that require careful evaluation.
How do demographic differences between Brea and Fullerton affect my selling prospects?
Demographic characteristics profoundly influence buyer demand intensity and pricing power in each community. Brea maintains a distinctly affluent buyer pool with median household income of $124,837, approximately 20% higher than Fullerton’s $104,219 7,8,10,11. This income differential translates directly into greater purchasing power for Brea buyers, supporting premium home prices in the $1 million+ range. Brea’s 60.3% homeownership rate indicates that nearly two-thirds of residents are property owners with accumulated equity available for upgrading, creating sustained local demand 7. Fullerton’s 51.5% homeownership rate suggests nearly half of occupied units are rentals, creating a larger renter population with potentially less purchasing power 8. Additionally, 78% of Brea homebuyers searched to remain within the metro area, with significant interest from high-cost Bay Area markets where buyers have accumulated substantial equity 4. These demographics create multiple buyer segments with demonstrated capacity for premium pricing. For sellers, Brea’s affluent, owner-oriented population generates the competitive bidding and above-list-price offers that maximize net proceeds, while Fullerton’s more diverse demographic supports broader but less premium-focused demand.

Wendy Rawley
REALTOR® | DRE #01898824
Wendy Rawley and The Wendy Rawley Team at First Team Real Estate have helped hundreds of North Orange County families work through their real estate journeys. With deep local expertise in Brea and surrounding communities, Wendy provides personalized guidance for every client.
📍 Office: First Team Real Estate, 18180 Yorba Linda Blvd, Suite 501, Yorba Linda, CA 92886
📞 Phone: (714) 746-6355
🌐 Website: go2wendy.com
Serving: Yorba Linda, Placentia, Brea, Fullerton, Anaheim Hills, Anaheim, La Habra, Orange
Important Disclaimer
This article provides general information about real estate in Brea and North Orange County. Real estate markets change constantly, and individual circumstances vary significantly. This content does not constitute financial, tax, or legal advice. Consult qualified professionals, including real estate agents, CPAs, and attorneys, before making real estate decisions. Wendy Rawley is a licensed California real estate agent (DRE #01898824) and provides this information for educational purposes only.
Sources
- Zillow – Brea Home Values , Average home value and year-over-year price trends for Brea, CA (December 2025)
- Redfin – Brea Housing Market , Median sale price, price per square foot, and competitive market data (December 2025)
- Zillow – Fullerton Home Values , Average home value and year-over-year trends for Fullerton, CA (December 2025)
- Redfin – Fullerton Housing Market , Median sale price, competitive score, and market velocity data (December 2025)
- GreatSchools – Brea-Olinda High School , School rating and academic performance metrics
- GreatSchools – Fullerton Union High School , School rating and graduation data
- World Population Review – Brea Demographics , Population, median income, and homeownership statistics (2023-2024)
- World Population Review – Fullerton Demographics , Population trends, income, and demographic composition (2023-2024)
- HomeLight – Real Estate Commission Rates by State , California average commission structure and ranges (2025)
- Bankrate – Closing Costs by State , California seller closing costs breakdown and averages
- City of Brea – Parks and Recreation , Municipal parks inventory and amenities
- City of Fullerton – Parks Department , Park facilities and recreational infrastructure
- Brea-Olinda Unified School District , High school programs, AP offerings, and graduation statistics
- Fullerton Joint Union High School District , Fullerton Union High School academic programs and performance
- Orange County Assessor’s Office , Property tax rates and transfer tax information