Selling a Rental Property in Orange: Should You Sell Now or Wait?
![]()
Selling a Rental Property in Orange: Should You Sell Now or Wait?
An Orange Real Estate Guide for Landlords Weighing Their Options in Spring 2026
Quick Answer
Homes in Orange sell in a median of 37 days, but prices have declined approximately 2.0% year over year.1 For most rental property owners carrying negative or break-even cash flow, selling in spring 2026 protects equity before holding costs erode it further.
For landlords who don’t plan to hold their Orange rental for the next five-plus years, selling now in this seller’s market typically offers a cleaner exit than waiting for a rebound that may not materialize soon. Holding makes more sense only when your rental generates strong positive cash flow, and you have a long-term investment horizon.
The Landlord’s Dilemma: Why This Decision Feels So Paralyzing Right Now
If you own a rental property in Orange, California (Orange County), and you’ve been going back and forth on whether to sell, many homeowners feel the same. The math feels genuinely uncertain right now, and there’s a reason for that. The current Redfin median sale price in Orange is $1,157,0001, yet prices have declined approximately 2.0% year over year, based on recent Redfin data.1 This reflects recent trends and may not continue. So you’re sitting on a substantial asset that’s technically losing value while your expenses keep climbing.
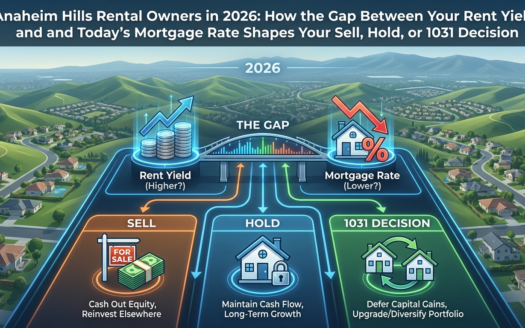
The Census-reported median rent in Orange is $2,327 per month, which translates to a gross rental yield of roughly 2.4% relative to the $1,157,000 median sale price.1 With prices declining about 2.0% year over year, recent appreciation has not compensated for that thin yield.
Between property taxes, insurance, maintenance, and potential vacancy, many Orange landlords absorb 3-5% of their property’s value annually in carrying costs. On a home near the $1,157,000 median, that’s roughly $35,000 to $58,000 per year before you account for any mortgage payment.
Meanwhile, 30-year mortgage rates sit at 6.46%3 which restricts the buyer pool for your property and limits how aggressively buyers can bid. The median household income in Orange is $117,113, according to Census Bureau ACS data2 which means many local buyers are stretching to afford homes at this price point. With 2.3 months of supply, Redfin data indicates Orange currently leans toward a seller’s market, based on recent inventory levels1 so demand hasn’t collapsed. But the combination of softening prices and elevated rates creates a genuine tension: sell now while you still have leverage, or hold and hope the market turns.
What makes this decision paralyzing is that both options carry real risk. Selling means locking in today’s prices and potentially facing capital gains taxes. Holding means absorbing ongoing costs while the market may continue to soften. We consistently see landlords delay this decision for months, and the delay itself becomes the most expensive choice.
Why the “Just Wait for a Better Market” Approach Often Backfires
The default strategy for most landlords is to hold indefinitely, assuming prices will eventually climb higher. But waiting has a real cost, and the Orange market right now illustrates exactly why patience isn’t always profitable.
🏠 Orange Market Snapshot
The Holding Cost Trap
Every month you hold a rental property, you’re absorbing property taxes, insurance, maintenance, and vacancy risk. When you factor in property taxes, insurance, maintenance, and potential vacancy, many Orange homeowners in this situation carry $4,000 to $6,000 or more per month in total ownership costs if the property is mortgaged. Even on a free-and-clear property, annual carrying costs of $35,000 to $58,000 add up quickly. With prices declining approximately 2.0% year over year1 your equity isn’t growing fast enough to offset those expenses in most cases.
Consider the spread between what sellers ask and what buyers actually pay. The median list price in Orange is $1,250,000, while the median sale price is $1,157,000. Based on the same-period median figures, these numbers reflect different pools of homes, but the pattern suggests that sellers who overprice are already adjusting downward. About 14.3% of listings have taken price reductions1 which tells you sellers who wait too long or price too aggressively are giving back ground.
Opportunity Cost of Locked-Up Equity
If you have substantial equity in your Orange rental, that money is essentially earning whatever return the property generates, which right now is a gross yield near 2.4% on rental income alone, minus all your expenses. A landlord with several hundred thousand dollars in equity could redeploy that capital into investments that yield more, with fewer headaches and no midnight maintenance calls. The sale-to-list ratio in Orange is approximately 98.8%1 which means you can still extract close to your asking price if you list correctly. Waiting risks that ratio compressing further.
Before you set your price, pull a hyper-local comp analysis of the three most recent sales within half a mile of your property. That single step will tell you more about your realistic exit price than any macro forecast.
A Smarter Framework: How to Evaluate Selling Your Orange Rental in Spring 2026
Instead of agonizing over whether the market will be higher or lower in a year, focus on three concrete factors that determine whether selling or holding makes financial sense for your specific situation right now.
Scenario A: Sell Now and Redeploy
Selling in spring 2026 lets you capitalize on what’s still a seller-leaning market. Orange has 84 pending sales against 73 new listings1 which means buyer demand is currently absorbing new inventory at a healthy pace. Homes sell in a median of 37 days1 and 36.5% of homes sold above their list price in the most recent period.1 Those numbers suggest you can exit without sitting on the market for months. If you sell at the current median and net roughly 5-6% less after commissions and closing costs (commissions are always negotiable between parties), you walk away with significant capital to pay down other debt, invest elsewhere, or simply eliminate the management burden.
This path is strongest when your rental cash flow is break-even or negative, when you’ve owned long enough to build substantial equity, or when you’d rather not absorb another year of holding costs while the market softens.
Scenario C: 1031 Exchange Into a Stronger Asset
| Strategy | Timeline | Tax Impact | Best For |
|---|---|---|---|
| Sell Now & Redeploy | 37 days median to close1 | Capital gains due at sale; consult CPA | Owners with negative cash flow or a short-term horizon |
| Hold & Rent | Indefinite; reassess annually | Deferred; ongoing depreciation deductions | Owners with strong positive cash flow and a 5+ year horizon |
| 1031 Exchange | 45 days to identify, 180 days to close | Deferred if executed correctly; strict IRS rules | Owners wanting to stay in real estate but exit this asset |
Your Step-by-Step Game Plan: Preparing to Sell a Rental Property in Orange
If selling makes sense for your situation, here’s the sequence that protects your timeline and your bottom line, calibrated to the spring 2026 market.
Step 1: Review Your Lease and Notify Your Tenant
Your first step is to review the current lease. If your tenant is month-to-month, California law typically requires 60 days’ written notice for tenancies over one year. If you’re mid-lease, you have two options: wait for the lease to expire, or sell with the tenant in place (which can appeal to investor buyers). Consult a local real estate attorney for your specific situation, as tenant protection laws in California are nuanced. Start this process now so your timeline aligns with a listing date that captures peak spring demand.
Step 2: Price It Based on What’s Actually Selling
Pricing strategy is where most landlord-sellers make their biggest mistake. The median price per square foot in Orange is roughly $6221 but that number varies dramatically between neighborhoods. A renovated home near the Orange Circle commands a premium over a comparable property further out. The sale-to-list ratio of approximately 98.8% tells you buyers are paying close to asking1 but 14.3% of listings have taken price drops1 which means overpriced homes sit. In our experience across 14 Orange transactions, properties priced right from day one averaged 31.8 days on market, slightly faster than the citywide median of 37 days.1
Step 3: Prepare the Property Without Over-Investing
Rental properties often need attention before listing. Focus on the items that affect buyer perception most: fresh exterior paint (Southern California weather lets you do this any time of year), clean landscaping with drought-tolerant plants, and addressing any deferred maintenance your tenants have reported. If the property backs to open space or a canyon, make sure brush clearance is current to 100 feet, as buyers and inspectors will check. You don’t need a full remodel. Spend on cleaning, paint, and curb appeal. Skip the kitchen renovation.
Step 4: Market to Both Owner-Occupants and Investors
With 119 active listings in Orange1 and 84 pending sales1 your property enters an active market. Position your listing to attract both owner-occupant buyers (who typically pay more) and investors (who can close faster and don’t mind a tenant in place). Highlight location-specific advantages: proximity to the Orange Circle, nearby trails at Santiago Oaks Regional Park, or the walkability of neighborhoods like El Modena and West Floral Park. These details matter to buyers choosing between competing listings in the local market.
Ready to Decide on Your Orange Rental Property?
- Run Your Numbers: Calculate your actual monthly cash flow after all expenses. If it’s negative or break-even, selling now preserves your equity before holding costs eat into it further.
- Get a Comp Analysis: We can pull hyper-local comparable sales for your specific Orange neighborhood so you price accurately from day one.
- Review Your Tax Exposure: Speak with your CPA about capital gains, depreciation recapture, and whether a 1031 exchange fits your reinvestment goals.
- Reach Out to Us: With 190 closed transactions across North Orange County and profound experience in the Orange real estate market, we can walk you through every step, from tenant coordination to closing. Call us at (714) 746-6355 or visit go2wendy.com.
Frequently Asked Questions About Selling a Rental Property in Orange
What is the current median sale price for homes in Orange, CA?
The current Redfin median sale price in Orange is $1,157,000, based on recent transaction data.1 Notably, prices have declined approximately 2.0% year over year based on recent Redfin data, and past performance does not guarantee future results. With homes currently selling in a median of 37 days and 2.3 months of supply at today’s pace, conditions lean toward a seller’s market, though your rental property’s specific condition and tenant status will affect your net proceeds.1
Is now a good time to sell a rental property in Orange, given current mortgage rates?
As of April 2, 2026, the 30-year fixed mortgage rate sits at 6.46% and the 15-year rate at 5.77%, according to Freddie Mac via FRED.3 Elevated rates compress the buyer pool, which may partly explain why Orange’s median sale price has dipped roughly 2.0% year over year based on recent Redfin data. Sellers should weigh this buyer-affordability pressure against their rental income, equity position, and the current local inventory of 119 active listings.1
Will selling my Orange rental property at the current median price require jumbo financing for buyers?
No. The current Redfin median sale price of $1,157,000 falls within the 2026 Orange County conforming loan limit of $1,249,125, according to FHFA.1,6 This means buyers can potentially use conventional conforming or FHA financing rather than jumbo loans, which broadens your eligible buyer pool. However, this price exceeds the standard baseline conforming limit of $832,750 that applies to non-high-cost counties, so the high-cost area designation matters here.
How quickly are homes actually selling in Orange right now, and what does that mean for my listing strategy?
In recent months, Orange homes have been selling in a median of 37 days, based on current Redfin data, though DOM is volatile and shifts seasonally.1 In the most recent reporting period, approximately 36.5% of homes sold above list price, and about 14.3% of listings experienced price drops.1 For a rental property, this suggests that pricing competitively from the start matters, since tenant-occupied homes often attract a narrower buyer pool and can sit longer than vacant properties.
Data in this article is sourced from Redfin (updated monthly), Freddie Mac PMMS, U.S. Census Bureau ACS, and HUD Fair Market Rent data. This article was last updated on 2026-04-09.
Not Sure Whether to Sell, Hold, or Exchange Your Orange Rental Property?
With 190 sales across North Orange County, we know exactly how smart preparation impacts your sale price. Let’s create a customized strategy for you.
📞 Call (714) 746-6355🌐 Visit go2wendy.com
Serving Orange and North Orange County since 2011 | DRE #01898824

Wendy Rawley
REALTOR® | DRE #01898824
Wendy Rawley and The Wendy Rawley Team at First Team Real Estate have helped hundreds of North Orange County families through their real estate decisions. With deep local expertise in Orange and the surrounding communities, Wendy provides personalized guidance for every client.
📍 Office: First Team Real Estate, 18180 Yorba Linda Blvd, Suite 501, Yorba Linda, CA 92886
📞 Phone:(714) 746-6355
🌐 Website:go2wendy.com
Serving: Yorba Linda, Placentia, Brea, Fullerton, Anaheim Hills, Anaheim, La Habra, Orange
Sources & Data
1Redfin – Orange Housing Market Data
URL: https://www.redfin.com/city/13969/CA/Orange/housing-market
Comprehensive housing market statistics, including median sale prices, inventory levels, days on market, and year-over-year trends for Orange properties as of 2026-02-28.
2U.S. Census Bureau – American Community Survey
URL: https://data.census.gov/profile?g=160XX00US0653980
Demographic data, including population (138266), median household income ($117113), and housing characteristics from the ACS 5-Year Estimates.
3Freddie Mac – Primary Mortgage Market Survey (via FRED)
URL: https://fred.stlouisfed.org/series/MORTGAGE30US
Current mortgage rate data: 30-year fixed at 6.46% and 15-year fixed at 5.77% as of 2026-04-02.
4City of Orange – Community Development
URL: https://www.cityoforange.org/171/Community-Development
Community development department with planning, housing, and economic development resources.
5Orange Chamber of Commerce – Business Resources
URL: https://www.orangechamber.com/business-resources/
Local business directory and economic development resources for the Orange business community.
6Yorbalindaca – Research Data
URL: https://www.yorbalindaca.gov/402/Trails
Government data and regulatory information relevant to selling a rental property in orange: should you sell now or wait?.
Important Disclaimer
This article provides general information about real estate in Orange and North Orange County. Real estate markets change constantly, and individual circumstances vary significantly. This content does not constitute financial, tax, legal, or mortgage lending advice. Mortgage rates, terms, and qualification criteria vary by lender and change frequently. Consult qualified professionals, including a licensed mortgage loan originator, CPA, and real estate attorney, before making real estate or financing decisions. Wendy Rawley is a licensed California real estate agent (DRE #01898824) and provides this information for educational purposes only.
Equal Housing Opportunity. We are committed to complying with all federal, state, and local fair housing laws.